• 概要
  • レビュー (1)
  • コメント

Smart entry trigger arrows

4

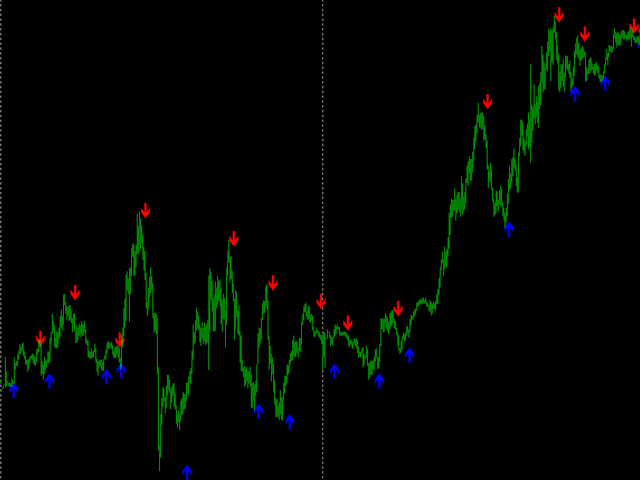
This indicator gives you nice trigger entry....whatever it is your trading style.  You can use on different timeframes and also you can select from the setting the sensibility of the indicator itself, changing the input parameter "cycle period".  For faster trigger signals you need to use shorter "cycle periods".  You can use it in reversal strategy as well as in trending strategy. 


Added:

- Sound Notification

- PopUp Notification

- Mobile Push Notification (To make it work follow the instructions: https://www.metatrader4.com/en/trading-platform/help/setup/settings_notifications)

if you buy the product feel free to contact me for additional info and tips

Have also a look at my other indicators, hoping you will find useful for your trading :)


レビュー 1
leavemealonepredators
228
leavemealonepredators 2023.06.15 20:56 
 

pretty good

おすすめのプロダクト
We present you the indicator "Candle closing counter", which will become your indispensable assistant in the world of trading. That’s why knowing when the candle will close can help: If you like to trade using candle patterns, you will know when the candle will be closed. This indicator will allow you to check if a known pattern has formed and if there is a possibility of trading. The indicator will help you to prepare for market opening and market closure. You can set a timer to create a p
Noize Absorption Index - is the manual trading system that measures the difference of pressure between bears forces and bulls forces. Green line - is a noize free index that showing curent situation. Zero value of index shows totally choppy/flat market.Values above zero level shows how powerfull bullish wave is and values below zero measures bearish forces.Up arrow appears on bearish market when it's ready to reverse, dn arrow appears on weak bullish market, as a result of reverse expectation. S
The Th3Eng PipFinite indicator is based on a very excellent analysis of the right trend direction with perfect custom algorithms. It show the true direction and the best point to start trading. With StopLoss point and Three Take Profit points. Also it show the right pivot of the price and small points to order to replace the dynamic support and resistance channel, Which surrounds the price. And Finally it draws a very helpful Box on the left side on the chart includes (take profits and Stop loss
TWO PAIRS SQUARE HEDGE METER INDICATOR Try this brilliant 2 pairs square indicator It draws a square wave of the relation between your two inputs symbols when square wave indicates -1 then it is very great opportunity to SELL pair1 and BUY Pair2 when square wave indicates +1 then it is very great opportunity to BUY pair1 and SELL Pair2 the inputs are : 2 pairs of symbols         then index value : i use 20 for M30 charts ( you can try other values : 40/50 for M15 , : 30 for M30 , : 10 for H1 ,
フィボナッチリトレースと拡張ラインツール DiNapoliポイント取引方法とゴールデンセクション取引を使用するトレーダーにとって理想的なMT4プラットフォームのフィボナッチリトレースと拡張ラインツール 主な特長: あなたはフィボナッチリトレースメントの複数のセットを直接描くことができ、重要なリターンポイント間の関係は一目瞭然です。 2.フィボナッチ拡張を描画することができます。 3.フィボナッチフォールドバックとラインの延長は、簡単な観察と数値表示のために左右に動かすことができます。 4.チャートは非常に爽やかな 5.数字キーでサイクルを切り替えることができます。 ファンクションキー: 1。 [戻るを押す、要求に応じて描画する、最大8つのグループにする 2。拡張]を描くには[押す] 3。 \を押すと、現在のサイクルの下にあるすべての拡張機能と折り畳みが削除されます 4。フォールドバックを移動して削除して展開する (1)最初のフォールドバックセットのF5行をクリックします。 一度クリックすると(黄色に変わります)、キーボードのDel
This is a trend indicator without redrawing Developed instead of the binary options strategy (by the color of the Martingale candlestick) Also works well in forex trading When to open trades (binary options) A signal will appear in the place with a candle signaling the current candle It is recommended to open a deal for one candle of the current timeframe M1 and M5 When a blue dot appears, open a deal up When a red dot appears, open a trade down. How to open trades on Forex. When a signal is rec
Improved version of the free HMA Trend indicator (for MetaTrader 4) with statistical analysis. HMA Trend is a trend indicator based on the Hull Moving Average (HMA) with two periods. HMA with a slow period identifies the trend, while HMA with a fast period determines the short-term movements and signals in the trend direction. The main differences from the free version: Ability to predict the probability of a trend reversal using analysis of history data. Plotting statistical charts for analyz
Owl smart levels
Sergey Ermolov
4.58 (55)
MT5版  |   FAQ Owl Smart Levels Indicator   は、 Bill Williams   の高度なフラクタル、市場の正しい波構造を構築する Valable ZigZag、エントリの正確なレベルをマークする Fibonacci レベルなどの一般的な市場分析ツールを含む 1 つのインジケーター内の完全な取引システムです。 利益を得るために市場と場所に。 戦略の詳細な説明 インジケータを操作するための指示 顧問-取引助手 プライベートユーザーチャット ->購入後に私に書いて、私はプライベートチャットにあなたを追加し、あなたはそこにすべてのボーナスをダウンロードすることができます 力はシンプルさにあります! Owl Smart Levels   取引システムは非常に使いやすいので、専門家にも、市場を勉強し始めて自分で取引戦略を選択し始めたばかりの人にも適しています。 戦略と指標に秘密の数式や計算方法が隠されているわけではなく、すべての戦略指標は公開されています。 Owl Smart Levels を使用すると、取引を開始するためのシグナルをすばやく確認し、
Forex Gump
Andrey Kozak
2.83 (6)
Forex Gump is a fully finished semi-automatic trading system. In the form of arrows, signals are displayed on the screen for opening and closing deals. All you need is to follow the instructions of the indicator. When the indicator shows a blue arrow, you need to open a buy order. When the indicator shows a red arrow, you need to open a sell order. Close orders when the indicator draws a yellow cross. In order to get the most effective result, we recommend using the timeframes H1, H4, D1. There
This unique multi-currency strategy simultaneously determines the strength of trends and market entry points, visualizing this using histograms on the chart. The indicator is optimally adapted for trading on the timeframes М5, М15, М30, Н1. For the convenience of users, the indicator renders the entry point (in the form of an arrow), recommended take profit levels (TP1, TP2 with text labels) and the recommended Stop Loss level. The take profit levels (TP1, TP2) are automatically calculated for
The Volumebyprice.com Indicator for MetaTrader 4 features Volume Profile and Market Profile TPO (Time Price Opportunity). Volume and TPO histogram bar and line charts. Volume Footprint charts. TPO letter and block marker collapsed and split structure charts. Static, dynamic and flexible range segmentation and compositing methods with relative and absolute visualizations. Session hours filtering and segment concatenation with Market Watch and custom user specifications. Graphical layering, posit
VR Cub
Vladimir Pastushak
VR Cub は、質の高いエントリーポイントを獲得するためのインジケーターです。このインジケーターは、数学的計算を容易にし、ポジションへのエントリーポイントの検索を簡素化するために開発されました。このインジケーターが作成されたトレーディング戦略は、長年にわたってその有効性が証明されてきました。取引戦略のシンプルさはその大きな利点であり、初心者のトレーダーでもうまく取引することができます。 VR Cub はポジション開始ポイントとテイクプロフィットとストップロスのターゲットレベルを計算し、効率と使いやすさを大幅に向上させます。取引の簡単なルールを理解するには、以下の戦略を使用した取引のスクリーンショットを見てください。 設定、設定ファイル、デモ版、説明書、問題解決方法は、以下から入手できます。 [ブログ] レビューを読んだり書いたりすることができます。 [リンク] のバージョン [MetaTrader 5] エントリーポイントの計算ルール ポジションをオープンする エントリーポイントを計算するには、VR Cub ツールを最後の高値から最後の安値までストレッチする必要があります。
Heiken Ashi candle chart is an improved version of The Japanese candle chart, which can effectively filter the market "noise" of the Japanese candle chart. It is favored by many traders for its simplicity and intuition. For trend traders, the HA candle chart is a magic tool. Unlike the traditional Japanese candle chart, Heikenashi does not reflect the opening price, high price, low price and closing price of the market. Instead, Heikenashi calculates the value of a single K line in the dominant
The Point61 indicator is the result of many years of monitoring of price behavior of currency pairs and metals. It is not a secret, that in times of uncertainty, traders are looking for possible levels of support and resistance - the point, where price should stop its movement. There are 2 possible scenarios at these points: 1. Reverse (correction) to the opposite direction; 2. Breakthrough to continue movement. Very often these points are used to set stop orders - TakeProfit or
[ZhiBiCCI]インディケータは全てのサイクル使用に適しており、そして全ての市場品種にも適しています。 [ZhiBiCCI]緑色の実線は強気の発散の逆転です。緑色の点線は古典的な強気の発散です。 [ZhiBiCCI]赤への実線は逆弱気の発散である。赤い点線は古典的な弱気の発散です。 [ZhiBiCCI]はパラメータ(アラート、メール送信、通知送信)で設定でき、(true)に設定するとインスタント信号をアラームウィンドウに送信し、Eメール、インスタントメッセージを送信できます。 パラメータ設定の説明 [displayAlert]:これはアラームスイッチで、trueに設定され、矢印が表示されればプロンプトに自動的に警告され、falseに設定されれば警告されません。 [sendmail_NO_OFF]:これはメールを送信するためのスイッチで、trueに設定します。矢印が表示されていればMT4で設定したメールボックスにメールを送信し、falseに設定されていればメールを送信しません。 [sendnotification_NO_OFF]:これはインスタントメッセー
Basic Support and Resistance インジケータは、テクニカル分析を強化するために必要なソリューションです。このインジケータを使用すると、チャートにサポートレベルとレジスタンスレベルを投影できます/ mt5バージョン 機能 フィボナッチレベルの統合: サポートと抵抗レベルとともにフィボナッチレベルを表示するオプションを使用すると、私たちの指標は市場行動と逆転領域の可能性についてさらに深い洞察を提供します。 パフォーマンスの最適化: 各バーの開口部のみで拡張ラインを更新するオプションを使用すると、インジケータは、サポートレベルと抵抗レベルの精度を犠牲にすることなく最適なパフォーマンスを保証します。 入力 メイン設定 Timeframe:  この入力を通じて、より高い時間枠のサポートラインとレジスタンスラインをチャート上に表示することを選択できます。 Support/Resistance Strength [Number of Bars]:  この入力を使用して、サポートと抵抗の強度を決定できます。数が高いほど、サポート/抵抗がより強くなります。 Pri
これは、キャンドルの終値を予測する指標です。 このインジケータは、主にD1チャートでの使用を目的としていますが. この指標は、従来の外国為替取引とバイナリオプション取引の両方に適しています。 インジケーターは、スタンドアロンのトレーディングシステムとして使用することも、既存のトレーディングシステムへの追加として機能させることもできます。 このインジケーターは、現在のキャンドルを分析し、キャンドル自体の内部の特定の強度係数と、前のキャンドルのパラメーターを計算します。 したがって、この指標は、市場の動きのさらなる方向性と現在のキャンドルの終値を予測します。 この方法のおかげで、この指標は、短期の日中取引だけでなく、中期および長期の取引にも適しています。 インジケーターを使用すると、市場の状況の分析中にインジケーターが生成する潜在的な信号の数を設定できます。 インジケーターの設定には、このための特別なパラメーターがあります。 また、インジケーターは、チャート上のメッセージの形式で、電子メールで、およびPUSH通知の形式で、新しい信号について通知することができます。 購入後は必ず私に書いて
WaveMaster Pro : Advanced Market Analysis Indicator for MetaTrader 4 Overview WaveMaster Pro is an advanced MetaTrader 4 (MT4) indicator engineered to enhance trading strategies by offering a sophisticated analysis of market trends and price movements. By integrating sector analysis, micro wave detection, and price projection capabilities, WaveMaster Pro provides traders with actionable insights for better decision-making. Whether you are a novice trader or a seasoned professional, this tool is
The Riko Trend indicator is a revolutionary trend trading and filtering solution with all the important features of a trend tool built into one tool! The Riko Trend indicator is good for any trader, suitable for any trader for both forex and binary options. You don’t need to configure anything, everything is perfected by time and experience, it works great during a flat and in a trend. The Riko Trend indicator is a technical analysis tool for financial markets that reflects the current price
The indicator displays the data of the Stochastic oscillator from a higher timeframe on the chart. The main and signal lines are displayed in a separate window. The stepped response is not smoothed. The indicator is useful for practicing "manual" forex trading strategies, which use the data from several screens with different timeframes of a single symbol. The indicator uses the settings that are identical to the standard ones, and a drop-down list for selecting the timeframe. Indicator Parame
Trade with Gann on your side!! MASTER CIRCLE 360 CIRCLE CHART, originally created by Gann admitted that this is “The Mother of all charts”. It is one of the last studies that this great trader left for us. The numeric tab le is apparently quite simple like all the tables and is based on square numbers, the SQUARE OF 12 and is by evolution, one of the most important square numbers. Here we can find CYCLE, PRICE AND TIME thanks to angles and grades, to show past and future support and resistance.
Strong Retracement Points Pro demo edition! SRP (Strong Retracement/Reversal Points) is a powerful and unique support and resistance indicator. It displays the closest important levels which we expect the price retracement/reversal! If all level are broken from one side, it recalculates and draws new support and resistance levels, so the levels might be valid for several days depending on the market! If you are still hesitating to start using this wonderful tool, you can check this link to see h
Matrix is a Forex arrow indicator. Displays signals simply and clearly! The arrows show the direction of the transaction, and are colored accordingly, which can be seen in the screenshots. As you can see, trading with such an indicator is easy. I waited for an arrow to appear in the desired direction - I opened a deal. An arrow formed in the opposite direction - closed the deal. The indicator also displays the lines with the help of which the arrow signals are formed, taking into account the int
The Stepping Trend Indicator     The Steppi ng Trend indicator uses the  average true range  (ATR indicator) in its calculation. This gives you control to set your own average true range period, I set the Default as 10.   Indicator Details. Green Arrow Up: This means you are at the starting point of a new bullish trend, it’s time to buy.   Red  Arrow  Down : This means you are at the starting point of a new  bearish  trend, it’ s time to sell .   What if you miss the Arrow Signal?   No
Signal trend indicator. Detects the direction of the trend and is coloured accordingly.  Has built in audible and visual alerts when trends change. Can send notifications to your phone or email. Allows Trend and Counter-Trend trading. Works on all timeframes, all currency pairs, metals, indices and cryptocurrencies. Can be used with binary options. Distinctive features No re-drawing; Simple and clear settings; Four types of alerts; Works on all timeframes and all trading tools; Su
Akendicator X is a Non-repainting Indicator for trading at 5-15 minutes Timeframe.  Akendicator X extimates with clear arrows, in which direction the next candlestick will move. Pratically, when the length of the last candle reaches and exceeds a particular value (called Candle Power) immediately, after its closing, an arrow appears indicating whether the next candle could be Bullish or Bearish. I created a manual in pdf where you should learn exactly how to use AKENDICATOR X correctly; I will s
What are Heiken Ashi Candles? Heiken Ashi, derived from the Japanese term 'Heikin Ashi,' translates to average price bars. It's an indicator depicting price bars on a chart. Formula for Heiken Ashi candles: - Heiken Ashi opening price: (previous candle's opening + closing price) / 2 - Closing price Heiken Ashi: (opening + high + low + closing) / 4 - Heiken Ashi peak: Max of high, opening, or closing price - Heiken Ashi bottom price: Min of low, opening, or closing price How to Read Heik
Trend indicator with calculation of dynamic levels and signaling their intersection. Description of input parameters: StepTF = true; - Calculation of the indicator by closing the bar (true) or by each tick (false) BarsCount = 300; - Number of settlement bars Price = PRICE_CLOSE; - Type of price used TimeFrame = PERIOD_CURRENT; - Estimated timeframe TrendPeriod = 9; - Trend calculation period TrendDeviations = 4.9; - coefficient of deviation PeriodTrendSmooth = 1; - Trend smoothi
まず第一に、この取引ツールはノンリペイント、ノンリドロー、ノンラグの指標であり、プロの取引に理想的ですことを強調する価値があります。 オンラインコース、ユーザーマニュアル、デモ。 スマートプライスアクションコンセプトインジケーターは、新米から経験豊富なトレーダーまで、非常 に強力なツールです。Inner Circle Trader AnalysisやSmart Money Concepts Trading Strategiesなど、20以上の有用な指標を1つに組み合わせています。このインジケーターはスマートマネーコンセプトに焦点を当て、大手機関の取引方法を提供し、彼らの動きを予測するのに役立ちます。 特に、流動性分析に優れており、機関がどのように取引しているかを理解しやすくしています。市場のトレンドを予測し、価格の動きを慎重に分析するのに優れています。機関の戦略とトレードを合わせることで、市場の動向についてより正確な予測ができます。このインジケーターは多目的であり、市場構造を分析し、重要な注文ブロックを特定し、さまざまなパターンを認識するのに優れています。 このインジケー
このプロダクトを購入した人は以下も購入しています
Gann Made Easy は、ミスター・ギャンの理論を使用した取引の最良の原則に基づいた、プロフェッショナルで使いやすい外国為替取引システムです。 W・D・ガン。このインジケーターは、ストップロスとテイクプロフィットレベルを含む正確な買いと売りのシグナルを提供します。 PUSH通知を利用して外出先でも取引可能です。 購入後はご連絡ください!私の取引のヒントと素晴らしいボーナスインジケーターを無料で共有します! おそらく、ギャンの取引手法についてはすでに何度も聞いたことがあるでしょう。通常、ギャンの理論は初心者のトレーダーだけでなく、すでにある程度の取引経験がある人にとっても非常に複雑なものです。なぜなら、ギャンの取引手法は理論的にはそれほど簡単に適用できるものではないからです。私はその知識を磨き、最良の原則を私の外国為替インジケーターに組み込むために数年を費やしました。 このインジケーターは非常に簡単に適用できます。必要なのは、それをチャートに添付し、簡単な取引推奨事項に従うだけです。このインジケーターは常に市場分析の仕事を行い、取引の機会を探します。適切なエントリーポイントを検出
Please contact me after purchase to immediately get your PDF strategy + documentation for Trend Pulse !  Official release price of $99  ( 20 / 50 copies left). Next price is $199 . Introducing Trend Pulse , a unique and robust indicator capable of detecting bullish, bearish, and even ranging trends! Trend Pulse uses a special algorithm to filter out market noise with real precision. If the current symbol is moving sideways, Trend Pulse will send you a ranging signal, letting you know that
Gold Stuff
Vasiliy Strukov
4.9 (268)
Gold Stuff は、金専用に設計されたトレンド指標であり、あらゆる金融商品にも使用できます。 インジケーターは再描画せず、遅れません。 推奨時間枠 H1. それインディケータでフルオートExpert Advisor EA Gold Stuffが動作します。 あなたは私のプロフィールでそれを見つけることができます. 設定と個人的なボーナスを得るために、購入後すぐに私に連絡してください! トレンド スキャナーの強力なサポートを利用して、無料のインジケーターを入手し、プライバシーを守ります。あーみー!   設定 矢印を描く - オンオフ。 チャートに矢印を描く。 アラート - 可聴アラートのオンオフ。 メール通知 - オンオフ。 電子メール通知。 プチ通知 - オンオフ。 プッシュ通知。 次に、色域を調整します。 Gold Stuff は、金専用に設計されたトレンド指標であり、あらゆる金融商品にも使用できます。 インジケーターは再描画せず、遅れません。 推奨時間枠 H1. それインディケータでフルオートExpert Advisor EA Gold Stuff
Trend Punch
Mohamed Hassan
4.95 (21)
This indicator is unstoppable when combined with our other indicator called  Support & Resistance . After purchase, send us a message and you will get it   for  FREE as a BONUS! Introducing Trend Punch , the revolutionary forex trend indicator that will transform the way you trade! Trend Punch is uniquely designed to provide precise buy and sell arrows during strong market trends, making your trading decisions clearer and more confident. Whether you're trading major currency pairs or exotic sym
製品を購入する前に、以下の情報をお読みください。 Apollo Pips PLUS SP はユニークな製品です。これは、私の新しい「アポロ ピップス」インジケーターと、私のすべての取引インジケーターにアクセスできる「スーパー パック」ボーナスを手に入れたい人のためのものです。 Apollo Pips PLUS SP 製品を購入すると、実際には私の Apollo Pips インジケーターのまったく新しいバージョンを購入することになります。このバージョンのインジケーターには改良されたアルゴリズムと使いやすいパラメーターがあり、あらゆる市場およびあらゆる取引スタイルでインジケーターを使用する機会が得られます。 この製品の購入者は、私のスーパーボーナスとして、他のすべてのインジケーターにも無料でアクセスできます!私のすべての取引ツールにアクセスしたい場合は、この製品が最適です!:) しかし、これがすべてではありません!:) この製品のすべての購入者は、私の新しいインジケーターを無料で入手する資格もあります!:)新しい取引インジケーターを利用できるようになりました。私の特権のある「スーパー パッ
An exclusive indicator that utilizes an innovative algorithm to swiftly and accurately determine the market trend. The indicator automatically calculates opening, closing, and profit levels, providing detailed trading statistics. With these features, you can choose the most appropriate trading instrument for the current market conditions. Additionally, you can easily integrate your own arrow indicators into Scalper Inside Pro to quickly evaluate their statistics and profitability. Scalper Inside
まず第一に、この取引インジケーターは再描画されず、再描画されず、遅延しないことを強調する価値があります。これにより、手動取引とロボット取引の両方に理想的なものになります。 ユーザーマニュアル:設定、入力、戦略。 アトミックアナリストは、価格の強さとモメンタムを利用して市場でより良いエッジを見つけるためのPA価格アクションインジケーターです。ノイズや誤ったシグナルを除去し、取引ポテンシャルを高めるための高度なフィルターを備えています。複雑なインジケーターの複数のレイヤーを使用して、アトミックアナリストはチャートをスキャンし、複雑な数学的計算をシンプルなシグナルと色に変換します。これにより、どのような初心者トレーダーでも理解して使用し、一貫した取引の決定を行うことができます。 「アトミックアナリスト」は、新規および経験豊富なトレーダー向けにカスタマイズされた包括的な取引ソリューションです。プレミアムインジケーターとトップノッチの機能を1つの取引戦略に組み合わせ、すべてのタイプのトレーダーにとって汎用性のある選択肢にします。 デイリートレーディングとスキャルピング戦略:高
通貨強さウィザードは、取引を成功させるためのオールインワン ソリューションを提供する非常に強力な指標です。このインジケーターは、複数の時間枠のすべての通貨のデータを使用して、このまたはその外国為替ペアのパワーを計算します。このデータは、使いやすい通貨インデックスと通貨パワーラインの形式で表され、特定の通貨のパワーを確認するために使用できます。 必要なのは、取引したいチャートにインジケーターを接続することだけです。インジケーターは、取引する通貨の実際の強さを示します。このインジケーターは、トレンドに合わせて取引するときに有利に利用できる売買高の圧力の極値も示します。このインジケーターには、フィボナッチに基づく可能なターゲットも表示されます。 このインジケーターは、PUSH 通知を含むあらゆるタイプのアラートを提供します。 購入後ご連絡下さい。私の取引のヒントをあなたと共有し、素晴らしいボーナスインジケーターを無料で提供します! 幸せで有益な取引をお祈りします。
現在20%OFF! 初心者やエキスパートトレーダーのためのベストソリューション! このダッシュボードソフトウェアは、28の通貨ペアで動作しています。それは私達の主要な指標(高度な通貨の強さ28と高度な通貨インパルス)の2に基づいています。それは全体の外国為替市場の大きい概観を与えます。それは、すべての(9)時間枠で28の外国為替ペアのための高度な通貨の強さの値、通貨の動きの速度と信号を示しています。チャート上で1つのインディケータを使用して市場全体を観察し、トレンドやスキャルピングの機会をピンポイントで見つけることができたら、あなたのトレードがどのように改善されるか想像してみてください。 このインディケータには、強い通貨と弱い通貨の識別、潜在的な取引の識別と確認がより簡単になるような機能が搭載されています。このインディケータは、通貨の強さや弱さが増加しているか減少しているか、また、すべての時間枠でどのように機能しているかをグラフィカルに表示します。 新機能として、現在の市場環境の変化に適応するダイナミックなマーケットフィボナッチレベルが追加され、すでに当社のAdvan
M1 Arrow
Oleg Rodin
4.73 (15)
市場の2つの基本原則に基づく日中戦略。 このアルゴリズムは、追加のフィルターを使用したボリュームと価格の波の分析に基づいています。インディケータのインテリジェントアルゴリズムは、2つの市場要因が1つに結合した場合にのみシグナルを出します。インディケータは、より高い時間枠のデータを使用して、M1チャート上の特定の範囲の波を計算します。そして波を確認するために、インジケーターはボリュームによる分析を使用します。 このインディケータはレディトレーディングシステムです。トレーダーが必要とするのは、信号に従うことだけです。また、インジケーターはあなた自身の取引システムの基礎になることができます。取引はミニッツチャートでのみ行われます。 インジケーターがMTFの原則を使用しているという事実にもかかわらず、インジケーターのアルゴリズムは可能な限り安定しています。 購入後、必ず私に書いてください!私の取引設定と推奨事項をあなたと共有します!
Trend Screener
STE S.S.COMPANY
4.81 (91)
トレンドインジケーター、1つのツールに組み込まれたすべての重要なトレンド機能を備えたトレンドトレーディングとフィルタリングのための画期的なユニークなソリューション! これは、すべてのシンボル/商品(外国為替、商品、暗号通貨、インデックス、株式)で使用できる100%再描画されていないマルチタイムフレームおよびマルチ通貨インジケーターです。 トレンドスクリーナーは、チャート内のドットで矢印トレンドシグナルを提供するインジケーターに続く効率的なインジケーターです。 トレンド分析インジケーターで使用できる機能: 1.トレンドスキャナー。 2.最大利益分析を備えたトレンドライン。 3.トレンド通貨強度メーター。 4.アラート付きのトレンド反転ドット。 5.アラート付きの強いトレンドドット。 6.トレンド矢印 毎日の分析例、毎日のシグナルパフォーマンス...など、トレンドスクリーナーインジケーターを使用して、ここで見つけることができます: ここをクリックしてください 期間限定オファー:トレンドスクリーナーインジケーターは、50ドルと生涯でのみご利用いただけます。 (元の価格125 $) MQ
mql5と Telegramの モーニング・ブリーフィングで、詳細とスクリーンショットを含む毎日のマーケット・アップデートをご覧 ください! FX Power MT4 NGは 、長年の人気を誇る通貨強度計FX Powerの次世代モデルです。 この次世代ストレングスメーターは何を提供するのでしょうか?初代FXパワーの魅力すべて プラス GOLD/XAUの強さ分析 より正確な計算結果 個別に設定可能な分析期間 カスタマイズ可能な計算上限値により、さらに優れたパフォーマンスを実現 もっと見たい人のための特別なマルチインスタンス設定 すべてのチャートでお好みの色を無限に設定可能 数え切れないほどの通知オプションにより、重要なことを見逃すことはありません。 Windows 11とmacOSのスタイルで角を丸くした新しいデザイン 魔法のように動くインジケーターパネル FXパワーの主な機能 すべての主要通貨の強さの完全な履歴 すべての時間枠における通貨の強さの履歴 すべてのブローカーとチャートで同一の計算結果 100%信頼できるリアルタイム計算 -> リペイントなし ドロップダウン・リストから
現在26%オフ 初心者やエキスパートトレーダーに最適なソリューション! このインジケーターは、独自の機能と新しい計算式を取り入れた、ユニークで高品質、かつ手頃な価格のトレーディングツールです。たった1枚のチャートで28の為替ペアの通貨強度を読み取ることができます。新しいトレンドやスキャルピングチャンスの引き金となるポイントを正確に特定することができるので、あなたのトレードがどのように改善されるか想像してみてください。 ユーザーマニュアルはこちら  https://www.mql5.com/en/blogs/post/697384 これが最初の1本、オリジナルだ! 価値のないクローンを買わないでください。 特別な サブウィンドウの矢印で強い通貨の勢いを表示 GAPがあなたのトレードを導く! 基準通貨や気配値が売られすぎ・買われすぎのゾーン(外相フィボナッチレベル)にあるとき、個別チャートのメインウィンドウに警告表示。 通貨がレンジの外側から反落した場合、プルバック/リバーサルのアラート。 クロスパターンの特別なアラート 複数の時間枠を選択可能で、トレンドを素早く
Ultimate Sniper Dashboard
Hispraise Chinedum Abraham
4.85 (27)
299ドルで割引中! 今後値上げの可能性あり! 下の説明を読んでください! 究極のスナイパーダッシュボードのための最高のエントリーシステム。究極のダイナミックレベル。(私の製品をチェックしてください) 究極のスナイパーダッシュボードはMT4多通貨テスト制限のため、ライブマーケットでのみ作動します。 究極のスナイパーダッシュボードをご紹介します。HA-Sniper、MA-Sniper、その他多くの特別なモードが含まれる最高の製品です。究極のスナイパーダッシュボードは絶対的な獣です! 初心者やエキスパートトレーダーにとって最高のソリューションです。もう二度と動きを見逃さない! シンプルさとピップを愛するトレーダーのために、特別な製品をご用意しました。シンプルでありながら、ダッシュボードは複数のカスタムアルゴリズムに基づき28の通貨ペアを監視し、すべての作業を行います。たった一つのチャートで、プロのように市場を読み解くことができます。もし、為替ペアが動き出したときに、その方向性を正確に特定することができれば、あなたの取引はどれほど改善されることでしょう。   当社のシ
Indicator : RealValueIndicator Description : RealValueIndicator is a powerful tool designed specifically for trading on the EURUSD pair. This indicator analyzes all EUR and USD pairs, calculates their real currency strength values, and displays them as a single realistic value to give you a head start on price. This indicator will tell you moves before they happen if you use it right. RealValueIndicator allows you to get a quick and accurate overview of the EURUSD currency pair tops and bottoms,
Reversal First Impulse levels (RFI)    INSTRUCTIONS        RUS       -       ENG              R ecommended to use with an indicator   -   TPSpro  TREND PRO -  Version MT5 A key element in trading is zones or levels from which decisions to buy or sell a trading instrument are made. Despite attempts by major players to conceal their presence in the market, they inevitably leave traces. Our task was to learn how to identify these traces and interpret them correctly. Main functions: Displaying activ
Cycle Sniper
Elmira Memish
4.44 (39)
NEW YEAR SALE PRICE FOR LIMITED TIME!!! Please contact us after your purchase and we will send you the complimentary indicators to complete the system Cycle Sniper is not a holy grail but when you use it in a system which is explained in the videos, you will feel the difference. If you are not willing to focus on the charts designed with Cycle Sniper and other free tools we provide, we recommend not buying this indicator. We recommend watching the videos about the indiactor and system before pu
ご紹介   クォンタム トレンド スナイパー インジケーターは 、トレンド反転を特定して取引する方法を変革する画期的な MQL5 インジケーターです。 13年以上の取引経験を持つ経験豊富なトレーダーのチームによって開発されました。     クォンタムトレンドスナイパーインジケーター   は、非常に高い精度でトレンドの反転を識別する革新的な方法で、あなたのトレーディングの旅を新たな高みに押し上げるように設計されています。 ***Quantum Trend Sniper Indicatorを購入すると、Quantum Breakout Indicatorを無料で入手できます!*** クォンタム ブレイクアウト インジケーターは、トレンドの反転を特定するとアラートを発し、矢印を示し、3 つのテイクプロフィットレベルを提案します。 初心者トレーダーにもプロのトレーダーにも適しています。 量子EAチャネル:       ここをクリック MT5のバージョン:       ここをクリック 推奨事項: 期間: すべての時間枠。最良の結果を得るには、
TakePropips Donchian Trend Pro
Eric John Pajarillaga Aldana
4.61 (18)
TakePropips Donchian Trend Pro   (MT4) は、ドンチャン チャネルを使用してトレンドの方向を自動的に検出し、エントリーとエグジットの取引シグナルを提供する強力で効果的なツールです! この多機能インジケーターには、トレンド スキャナー、取引シグナル、統計パネル、スクリーナー、取引セッション、およびアラート履歴ダッシュボードが含まれます。取引シグナルを提供し、チャートを分析する時間を節約するように設計されています! ユーザー マニュアルとインストール ガイドは、ブログ投稿 (   https://www.mql5.com/en/blogs/post/751368   ) からダウンロードできます。 今日は 50% オフ! 98ドルから49ドルに値下げ! このインジケーターは、ストラテジー テスターでテストできます (ビジュアル モードを有効にします)。 詳細については、説明の下にあるビデオ チュートリアルも利用できます。 ご不明な点やサポートが必要な場合は、私に連絡してください。 TakePropips Donchian Trend Pro イン
The indicator is designed to work on any trading platform. The program is based on proprietary algorithms and W.D.Ganna's mathematics, allowing you to calculate target levels of price movement based on three points with the highest degree of certainty. It is a great tool for stock trading. The indicator has three buttons: NEW - call up a triangle for calculation. DEL - delete the selected triangle. DELS - completely remove all constructions. The probability of achieving the goals is more than 80
BullsEye Signal NoRepaint
Martin Alejandro Bamonte
3 (2)
BullseyeSignal – NoRepaint は、名前が示すように、いかなる状況でも再描画されないシグナルです。シグナルは画像に表示された同じローソク足に表示されます。外為、暗号通貨、株式、指数、先物などの高ボラティリティ市場に最適です。 購入には緑の矢印、販売には赤の矢印のみが表示されますが、その背後にはより簡潔な取引体験を提供するために多くの指標が協力しています。 これは正確なエントリーを提供するために特別に設計されています。 多くのエントリーではなく、指標がトレンドの変化を示し、前のトレンドの反対方向に0レベルを超えたときに特定のエントリーを提供します。より正確な取引を実現するために、指標はトレンドの変化を確認するために最初のプルバックを待ち、偽の逆転を回避します。したがって、前のトレンドのブレイクとプルバックの確認後にシグナルが発行されます。 これは非常に慎重な取引アプローチです。 したがって、これらのヒントに従うことが重要です(初心者および上級トレーダーの両方がこの戦略を使用できます): ニューヨーク、ロンドン、または両市場の重複を使用することをお勧めします。
TPSpro TRENDPRO  - is a trend indicator that automatically analyzes the market and provides information about the trend and each of its changes, as well as giving signals for entering trades without redrawing! The indicator uses each candle, analyzing them separately. referring to different impulses - up or down impulse. Exact entry points into transactions for currencies, crypto, metals, stocks, indices!  -  Version MT5               DETAILED DESCRIPTION                R ecommended to use with
- Real price is 80$ - 50% Discount ( It is 39$ now ) Contact me for instruction, any questions! Introduction The breakout and retest strategy is traded support and resistance levels. it involves price breaking through a previous level.  The break and retest strategy is designed to help traders do two main things, the first is to avoid false breakouts. Many false breakouts start with a candlestick that breaks out of a level but ends with an immediate candlestick that brings the price back into t
Step into the realm of Forex trading with confidence and precision using XQ, a cutting-edge Forex indicator designed to elevate your trading game to unprecedented heights. Whether you're a seasoned trader or just stepping into the world of currency exchange,   XQ Forex Indicator   empowers you with the insights and signals needed to make informed trading decisions. The signal conditions are a combination of three indicators, and XQ Forex Indicator only display  medium and long-term trends . The
IX Powerは 、FX Powerの無敵の精度をついにFX以外のシンボルにも提供します。 お気に入りの指数、株式、コモディティ、ETF、さらには暗号通貨の短期、中期、長期のトレンドの強さを正確に判断します。 お使いの端末が提供する すべてを分析する ことができます。ぜひお試しいただき、取引 タイミングが大幅に改善 されることをご体験ください。 IXパワーの主な特徴 100%正確で再描画されない計算結果 - ターミナルで利用可能なすべての取引シンボルに対して 予め設定され、さらに個別に設定可能な強度分析期間のドロップダウン選択 Eメール、メッセージ、モバイル通知による無数の通知オプション EAリクエストのためのアクセス可能なバッファ カスタマイズ可能な計算制限により、さらに優れたパフォーマンスを実現 もっと見たい人のための特別なマルチインスタンス設定 すべてのチャートでお好みの色を無限に設定可能 Windows 11とmacOSのスタイルで角を丸くした新しいパネルデザイン サブ・ウィンドウとメイン・チャートの間をシームレスに移動する、魔法のように動く
カスタムMT4インジケーターで外国為替取引を成功させるための秘密を発見してください! 外国為替市場で成功を達成し、リスクを最小限に抑えながら一貫して利益を得る方法を疑問に思ったことはありますか? これがあなたが探している答えです! 取引へのアプローチに革命をもたらす独自のMT4インジケーターを導入できるようにします。 ユニークな汎用性 私たちのインジケータは、RenkoとRangeBarのろうそくのフォーメーションを好むユーザー向けに特別に設計されています。 これらのチャートタイプは多くの経験豊富なトレーダーに好まれていることを理解しています。そのため、私たちのインジケーターはそれらとシームレスに統合され、比類のない市場分析を提供します。 クリアトレンドシグナル 複雑な分析を忘れてください! 私たちのインジケーターは、鮮やかな色と明確なドット構造を利用して、市場の動向を明確に示しています。 赤と青の点は、価格の動きの方向性について疑いの余地がなく、取引の迅速な意思決定を可能にします。 HH/HL HL/LL戦略とのアライメント HH/HLおよびHL/LL構
Scalper Vault は、スキャルピングを成功させるために必要なすべてを提供するプロフェッショナルなスキャルピング システムです。このインジケーターは、外国為替およびバイナリー オプションのトレーダーが使用できる完全な取引システムです。推奨される時間枠は M5 です。 システムは、トレンドの方向に正確な矢印シグナルを提供します。また、トップとボトムのシグナルとギャン マーケット レベルも提供します。 インジケーターは、プッシュ通知を含むすべてのタイプのアラートを提供します。 インジケータの購入後にご連絡ください。私の個人的な取引の推奨事項と素晴らしいボーナス指標を無料で共有します! 幸せで有益な取引をお祈りします!
現在31%オフ! 初心者やエキスパートトレーダーに最適なソリューション! このインジケータは、独自の機能と秘密の数式を組み込んだ、ユニークで高品質かつ手頃な価格のトレーディングツールです。たった1枚のチャートで28の通貨ペアのアラートを表示します。新しいトレンドやスキャルピングチャンスの引き金となるポイントを正確に把握することができるので、あなたのトレードがどのように改善されるか想像してみてください! 新しい基本的なアルゴリズムに基づいて構築されているため、潜在的な取引の特定と確認がより簡単になります。これは、通貨の強さや弱さが加速しているかどうかをグラフィカルに表示し、その加速のスピードを測定するためです。加速すると物事は明らかに速く進みますが、これはFX市場でも同じです。つまり、反対方向に加速している通貨をペアにすれば、利益を生む可能性のある取引を特定することができるのです。 通貨の勢いを示す縦の線と矢印は、あなたの取引の指針となるでしょう。 ダイナミックマーケットフィボナッチ23レベルはアラートトリガーとして使用され、市場の動きに適応します。もしインパルスが黄色
`All in One Chart Patterns` チャートパターンはトレーダーの間で議論の的となっています。信頼できるシグナルだと考える人もいれば、そうでないと考える人もいます。当社の「Chart Patterns All-in-One」インジケーターは、これらのパターンを表示し、自分自身で理論を検証できるようにします。これらのパターンの収益性は、インジケーターの有効性を反映するものではなく、むしろパターン自体の評価です。「Chart Patterns All-in-One」インジケーターは、これらのパターンを視覚化するための優れたツールであり、取引戦略における有効性について自分自身で結論を下すことができます。 このインジケーターは、複数のチャートパターンを1つの統合ツールに組み合わせて、MetaTrader 4 (MT4) で使用します。チャートから直接各パターンをオンまたはオフに切り替える機能を提供し、カスタマイズ可能で効率的な分析を可能にします。以下は、インジケーターとその中に含まれるパターンの詳細な説明です。 #### 含まれるパターン: 1. **パターン
The AT Forex Indicator MT4 is a sophisticated trading tool designed to provide traders with a comprehensive analysis of multiple currency pairs. This   powerful indicator   simplifies the complex nature of the forex market, making it accessible for both novice and experienced traders. AT Forex Indicator uses   advanced algorithms   to detect trends, patterns and is an essential tool for traders aiming to enhance their forex trading performance. With its robust features, ease of use, and reliabl
作者のその他のプロダクト
Innovative Max Min swing   This is a really different indicator for drawing Max and Min on the charts.  This indicator draws Min and Max levels in a innovative way, based on a volatility proprietary calculation. In this way you will be able to draw trendlines in an objective way and also to see the break of Max and Min levels.  You have three paramaters you can play with, in order to suite the volatility to your trading style. The indicator works on every time frame. Added: - Sound Notification
Is the market ranging (balance) or trending (Imbalance) ? This indicator exports a huge concept used in volume analysis (value area) into the price action. It makes it on Intraday level.  How to read it?  Simple! But you need to make practice. Making profit in market is more than a 2-rule system. When the price inside the lines, the market is in "range mode".   If the price is above the upper line, the market is trending up.  If the price is below the lower line the market is  trending down
Clear trend filter   This is a filter-trend indicator.  From the settings you can select to use more filter or less. The very interesting part of the indicator comes out using with all the filter. In this way you can follow the trend easily even when the market is without a strong trend, but is instead more flat. I personally use it on 1 minutue timeframe with  MORE FILTER (you can select it from the input setting) in order to have an overlook of trend in the market.   Added: - Sound Notificatio
Equilibrium Levels support resistence   Intraday indicator --> it means it works on lower TimeFrames , from 1minute to 4hours.    This indicator is able to calculate and draw 2 levels (1 support and 1 resistence) representing the Barycenter's levels for a specific day session.    From the setting you can choose only one parameter, that's the lenght of Barycenter's orbit.   I personally attach the same indicator 2 times on the same chart, inputting as orbit:  0.15  and 0.30. Then what you will no
This indicator draws the projections of Fibonacci above the yesterday high and below the yesterday low.  Why?  1) First of all, in this you can take the pulse of the market (trend or range). For instance If the price runs above yesterday's high the trend is UP.  2) In this way you will have automatic targets for the trend 3) you can wait the market on excess levels for contrarian and low risk trades. If you buy the product feel free to contact me for additional tips or info. I wish you
This is a clear and simple filter I've created based on a Ichimoku strategy and setup. I personally like to use the indicator in a multi timeframe approach. It can be used in a double way:   1) Every time the indicator change the colour, you can use the this first change as your trigger point.  2) You can follow the indicator for the trend direction and trade with your other signals.  Added: - Sound Notification - PopUp Notification - Mobile Push Notification (To make it work follow
Never aginst the trend   This is a really top indicator indicating the main trend in a clear and easy way. I reccomend you to use it on multiple timeframe in  order to create a powerful view and strategy. It works on every market in the same way.  If you trade against the trend you will work more for less, so stick with the trend.  I hope you will find it useful. All the best with your trading! Keep it simple stupid, is the way! Added: - Sound Notification - PopUp Notification - Mobile Push Noti
Semi automatic system John Bollinger bands   Entry Bollinger Excess with Filter.With this indicator you can build your own semi-automatic strategy based on bollinger bands excess. You can play with the settings to find the best solution for your style and trading attitude.   The indicator shows a signal whenever it finds a trigger-entry(coded inside) based on bollinger bands excess and an additional trend-filter(moving average). This tool will support your manual trading in order to easily spot
This indicator can spot strong volume levels on different timeframes.   Everything is customised from the setting.   You can hide by the colour the leveles you don't need.   In this way you will map the market with reaction zone and you can use them as target levels or entry levels depending on your strategy. Hope you will find it useful and all the best with your trading.   Added: - Sound Notification - PopUp Notification - Mobile Push Notification (To make it work follow the instructions:  htt
'Zig Zag Percentage strenght'   This indicator is awesome. Why? It's able to show the percentage of the last leg, compared with the previous leg. In this way you have a better understanding of the forces in play in that moment.   In fact, for example, if you see that the up extensions are, in percentage, greater of the down legs, that means that there is more bullish pressure or maybe the market is starting to reverse from downtrend to uptrend.   Hope you will ind it useful !
I developed this vwap with more settings in order to be customized as much as possible.  VWAP is a really strong indicator for your trading. It can be used to check if the market is in balance or ranged, and also you can use the levels as support/resistence/target.  In the pictures you can see the main settings, and you can select the use of real volume from the broker. Hope you will find it useful. Many thanks in advance.  
フィルタ:
leavemealonepredators
228
leavemealonepredators 2023.06.15 20:56 
 

pretty good

レビューに返信