Volatility Scanner Multi TF
- インディケータ
- Federico Quintieri
- バージョン: 1.2
- アップデート済み: 23 1月 2023
- アクティベーション: 5
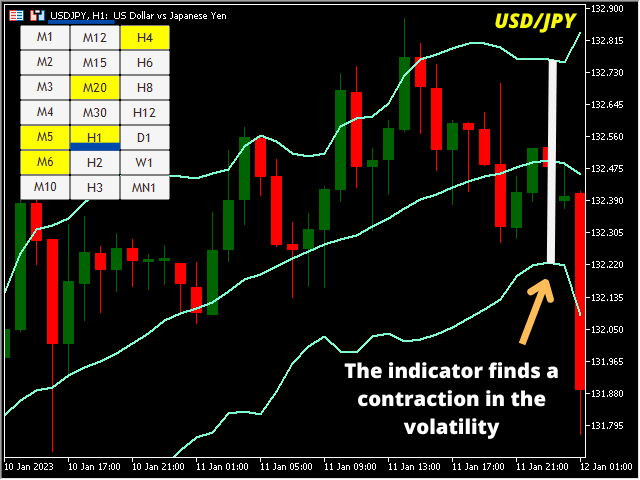
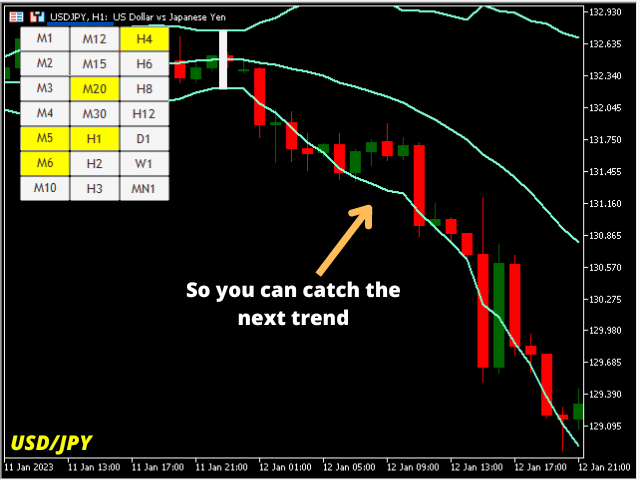
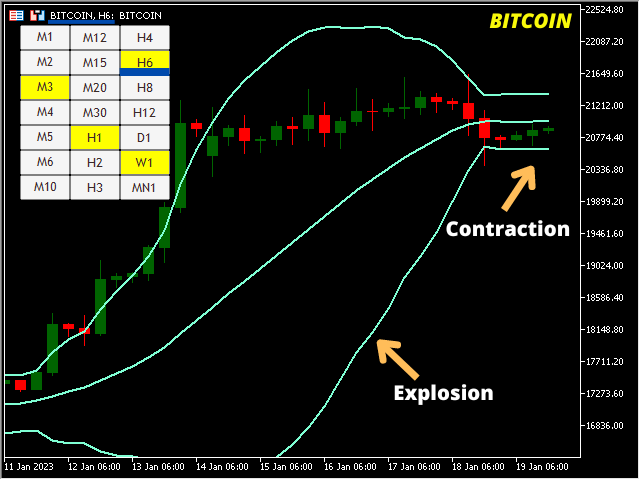
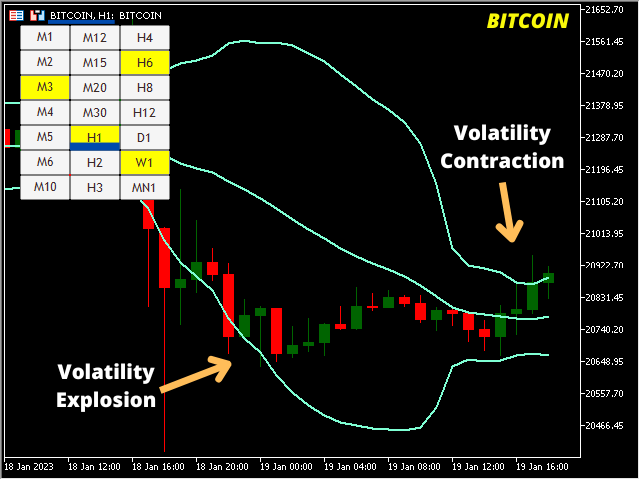
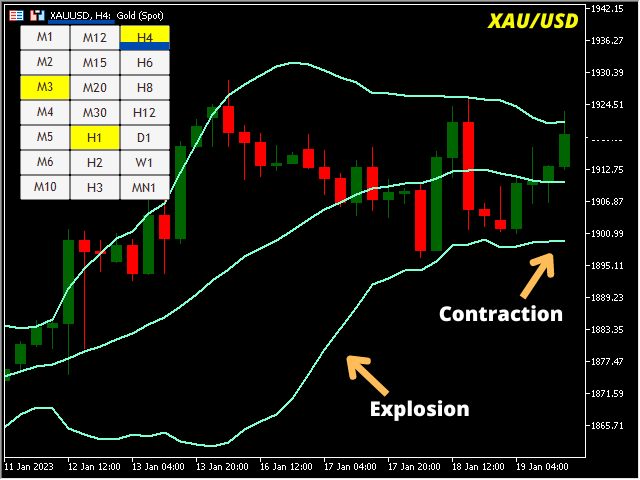
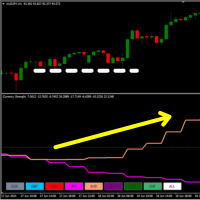
The volatility scanner indicator is a tool that helps traders identify and analyze volatility in all the market timeframes for the current chart.
This way you can find potentially profitable trades on every timeframe for the current symbol.
What It Does?
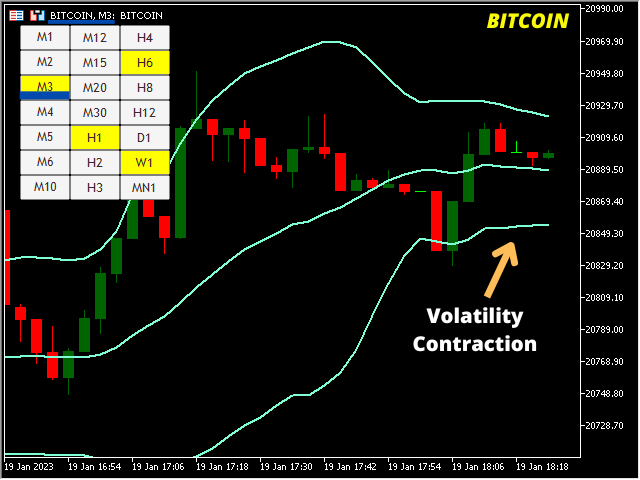
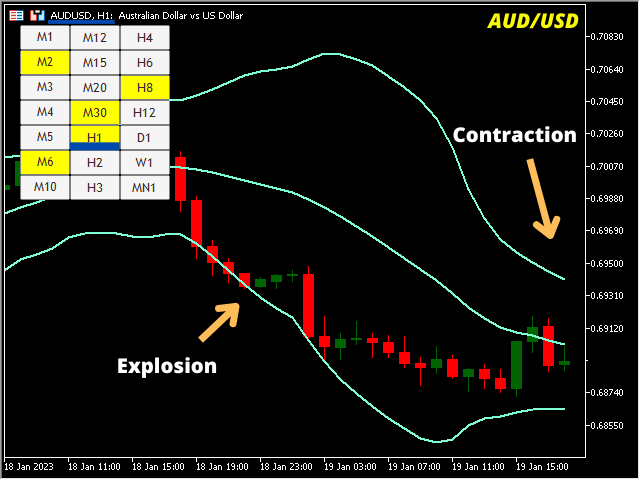
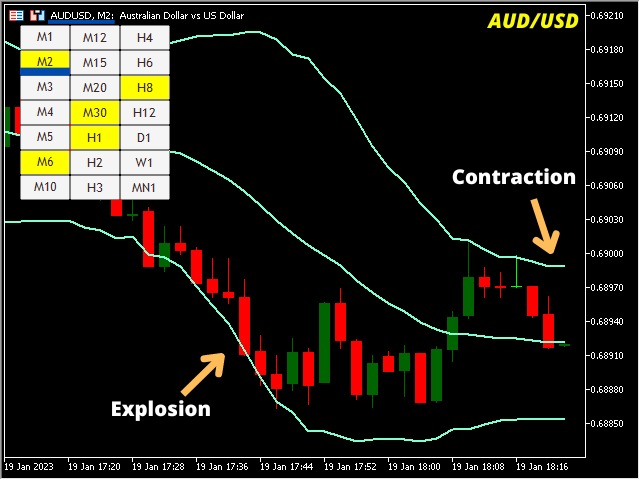
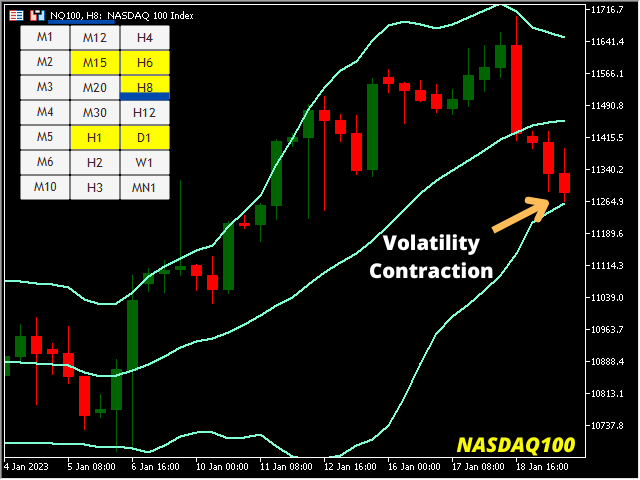
- Scan all timeframes to find a volatility contraction.
- Color the button yellow if there is a volatility squeeze at that timeframe.
- Clicking on the button instantly changes timeframe.
How To Use It?
Just put it on the chart and click on the yellow buttons for finding volatility squeezes.
Where Can It Be Used?
You can use it on any market as volatility exists on every type of exchange.
Who Is This Indicator For?
For those interested in taking advantage of market volatility.
What inputs can you change?
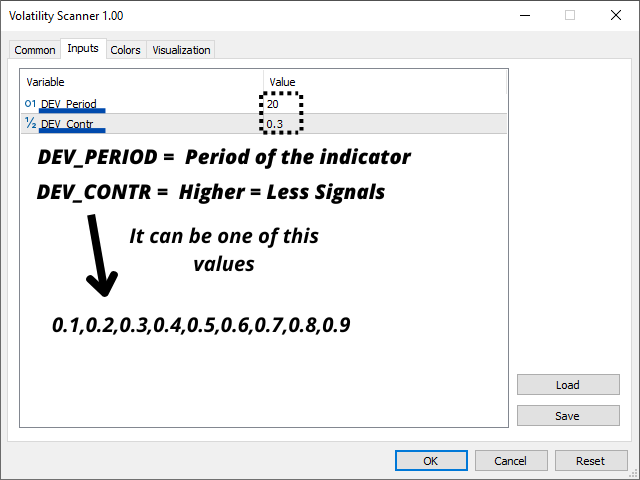
DEV_Period is the Period for the Standard Deviation Indicator.
You can choose the value you prefer: 10,20,30,40,50,60,ecc...
DEV_Contr is how much you want the market to contract.
You can choose one of this values: 0.1,0.2,0.3,0.4,0.5,0.6,0.7,0.8,0.9
The higher this value is, the fewer the signals will be because the indicator will look for a greater volatility contraction in the various timeframes.















ユーザーは評価に対して何もコメントを残しませんでした