SV Symbol health
- インディケータ
- Minh Truong Pham
- バージョン: 1.0
- アクティベーション: 5
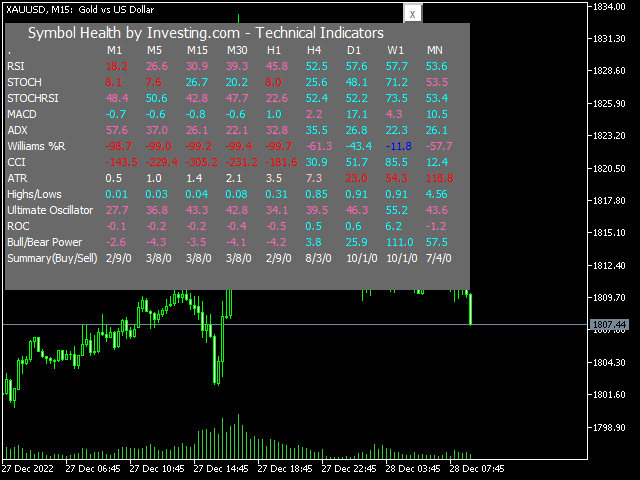
Inspired investing.com Technical Indicators, this indicator provides a comprehensive view of the symbol by synthesizing indicators including:
- RSI, StochRSI : have 3 level oversold - red, midle (aqua when upper, pink when lower), overbuy – blue
- Stoch: oversold – red, overbuy- blue, aqua when main line < signal line, pink when main line > signal line
- MACD: aqua when main line < signal line, pink when main line > signal line
- ADX: aqua when line plus > line minus, pink when line plus < line minus
- Williams %R: oversold – red, overbuy- blue, aqua when main line < signal line, pink when main line > signal line (value of Williams %R should lower than 0. Ex: -20, -50, -80)
- CCI: oversold(-100) - red, midle (aqua when upper, pink when lower), overbuy(100) – blue
- ATR: default volatility level is 3. Color is from white to red. Reder when higher. This indicator not include in total calculation.
- High/low: Formula is: ({New Highs / (New Highs + New Lows)} x 100-{New Highs / (New Highs + New Lows)} x 100) ; if value > 0 -> aqua; if value<0 => pink
- Ultimate Oscillator: oversold - red, midle (aqua when upper, pink when lower), overbuy – blue
- ROC: aqua when value>0, pink when value<0
Note:
You can show or hide panel by press button “x”. Panel will show/hide on next tick after click button.


