ALL IN 1 Divergence Macd Rsi Stochastic
- インディケータ
- Fatima Hosseini
- バージョン: 1.2
- アップデート済み: 13 12月 2023
- アクティベーション: 5
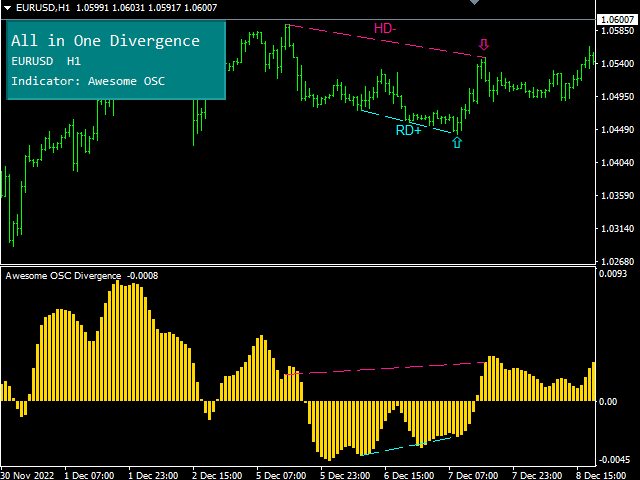
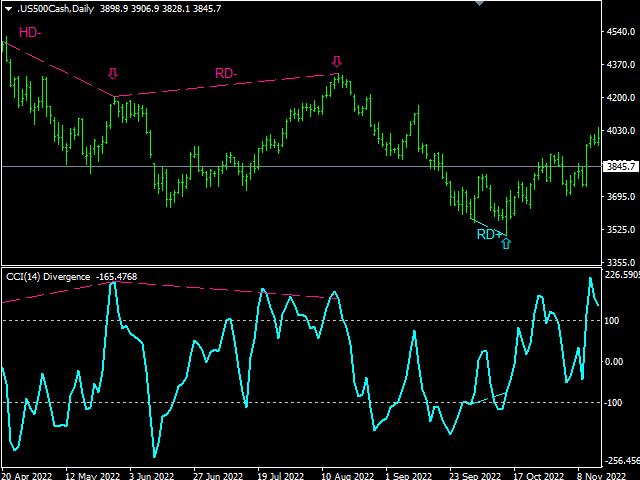
Divergence
Divergence refers to when the price of a currency pair moves in one direction while the trend indicator is moving in the opposite direction. With divergence, there can be positive and negative signals.
Divergences in Forex trading are quite common signals of technical analysis. These are basic early Forex signals indicating the trend reversal and filter false signals.
Application of this indicator
It is usually not easy to detect divergences by the trader and it may be time-consuming or the trader's diagnosis may be wrong.
Leave the job to this indicator, just drag it on the chart to automatically detect divergences.
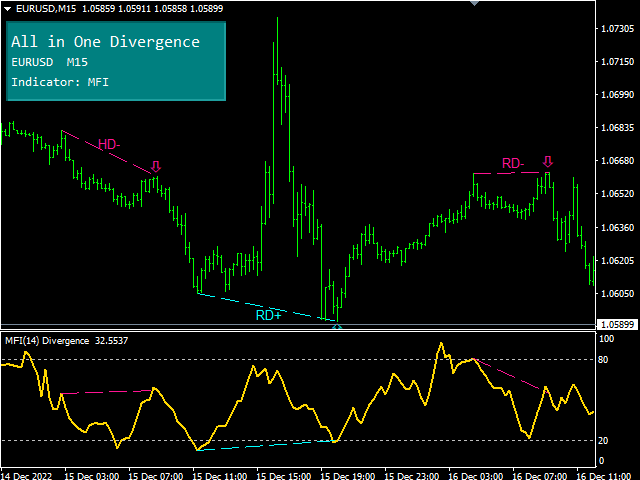
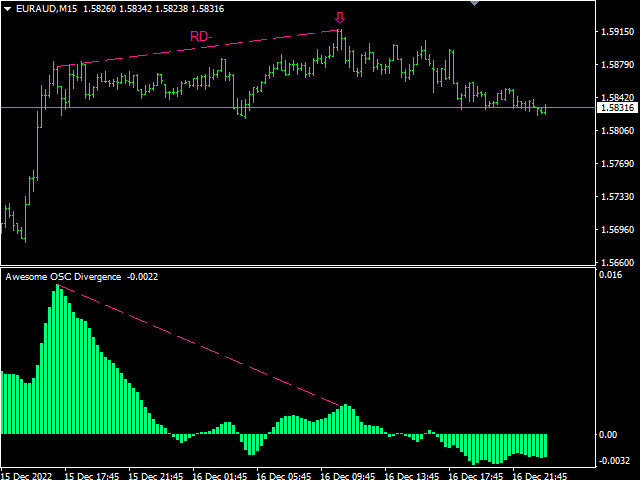
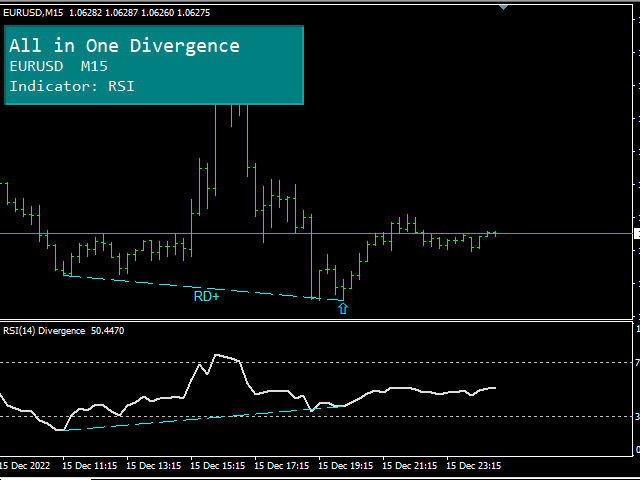
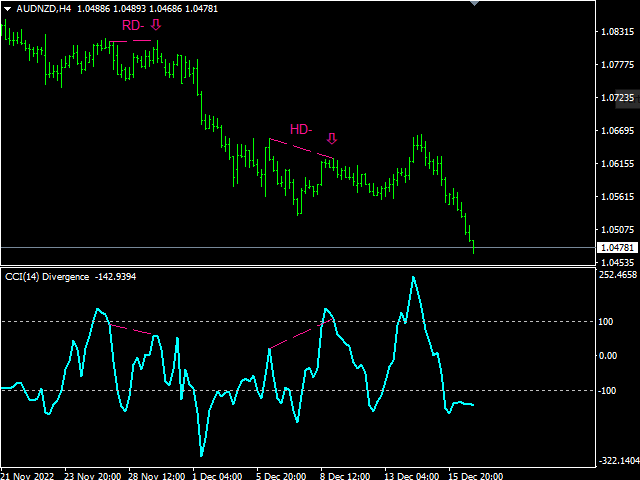
This indicator detects all regular (RD) and hidden (HD) divergences for 16 indicators by a unique algorithm.
Indicator parameters
· Oscillator/Indicator type: choose the indicator you want
· MACD inputs: set inputs for MACD indicator.
· Stochastic inputs: set inputs for Stochastic indicator.
· OsMA inputs: set inputs for OsMA indicator.
· Other indicators period: set inputs for the other indicators (Except MACD, Stochastic and OsMA).
· Prefix: To detect the signal in several indicators at the same time, in this case select the Prefix option differently.
· Other Parameters are because of the user Interface and alerts or notifications.
Abilities
· Divergence detection for all major indicators (16 indicators).
· User Interface
What market should I use?
With confidence in all markets such as Forex, stock market and Crypto market


It's actually a beautiful tool but my goodness it's too heavy, you put it on 10 pairs and my test laptop crashed.