Trend Stop
- インディケータ
- Mario Jemic
- バージョン: 1.11
- アップデート済み: 30 7月 2024
- アクティベーション: 5
Description of the Indicator
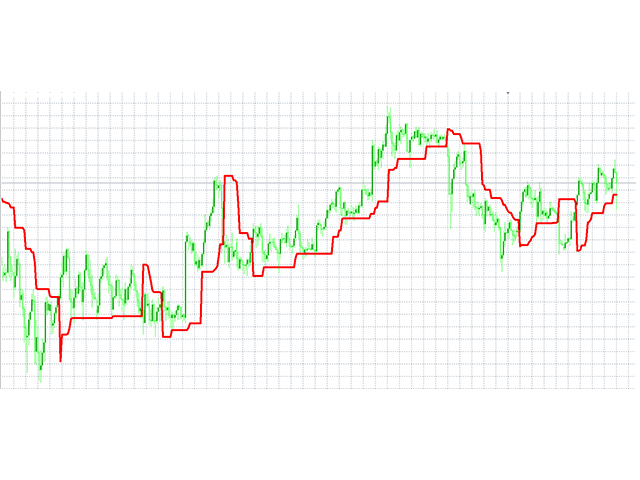
Trend Stop shows the highest/lowest value of the last N periods.
Can help traders identify the trend direction and potential stop levels.
Use Trend Stop indicator to detects the trend direction.
Downtrend
if the price crosses the Trend Stop line upwards
Uptrend
if the price crosses the Trend Stop line downwards
Use Trend Stop indicator to define optimal stop levels.
Downtrend
Place your stops above the Trend Stop line
Uptrend
Place your stops below the Trend Stop line
Parameters
- periods- number of periods used to calculate Trend Stop