TrendTunnel MT5
- インディケータ
- Vladimir Pokora
- バージョン: 1.1
- アップデート済み: 28 12月 2022
- アクティベーション: 5
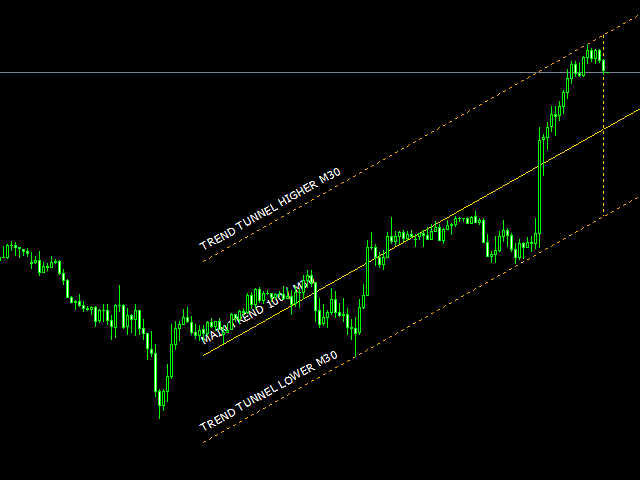
This indicator draws a trend line and a trend tunnel on the chart. You can choose several calculation methods, alerts, notifications, and other settings.
It can also draw trendlines from another TimeFrame.
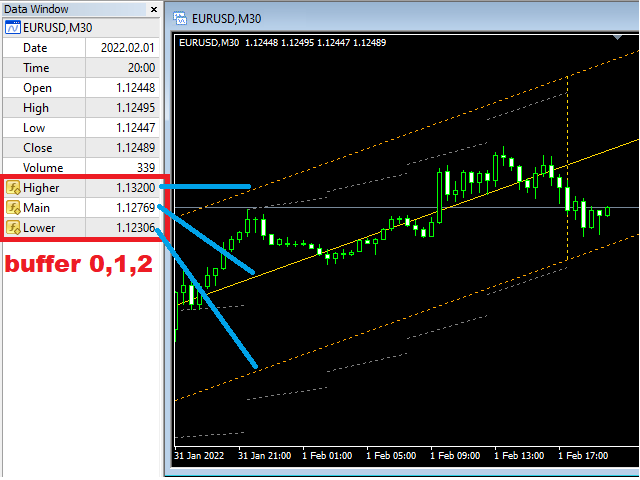
You can also use this indicator for your ExpertAdvisor. The current values of the lines are stored in the memory buffer from where the EA can load them.
You can trade the price bounce from the upper and lower lines.
Settings
- TimeFrame – trend timeframe
- Description – show description of lines
- Redraw interval – trend validity period/ number of candles
- Trend period – the number of candles to calculate the trend
- Apply to: - values for trend calculation
- TrendColor - main trendline color
- Trend tunnel method – tunnel calculation method
- ...Fixed distance – fixed distance of the tunnel from the trendline in points
- Tunnel % - tunnel dimension in %
- TunnelColor – tunnel color
- Show history – show older tunnels
- History color – color of the older tunnels
- Show alert – show alert when tunnel is hit
- Send email – send email when tunnel is hit
- Send notification – send a notification when tunnel is hit
- Chart bring to top – show chart when tunnel is hit
- Show grid – show grid in chart