MP Market Sessions for MT5
- インディケータ
- Pierre Ksachikian
- バージョン: 1.0
- アクティベーション: 6
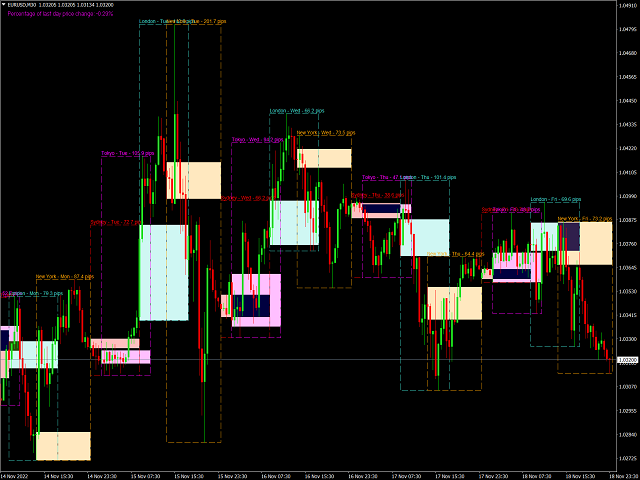
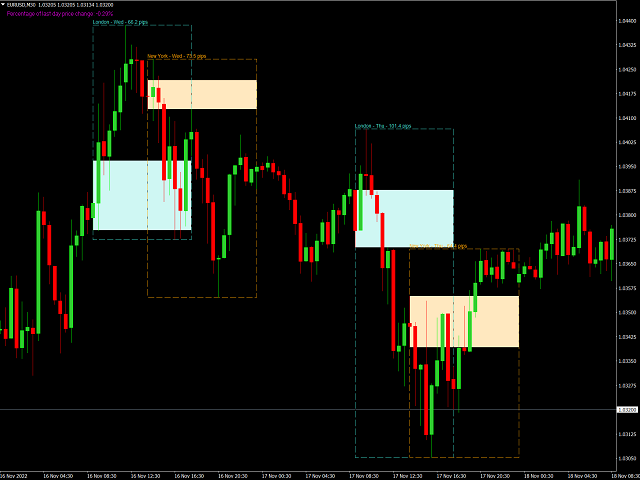
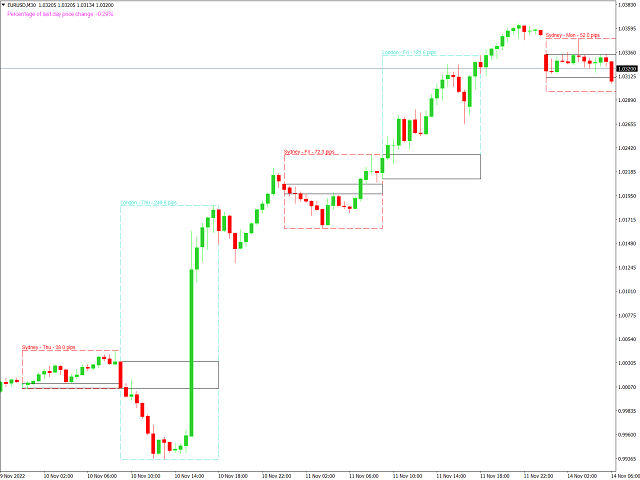
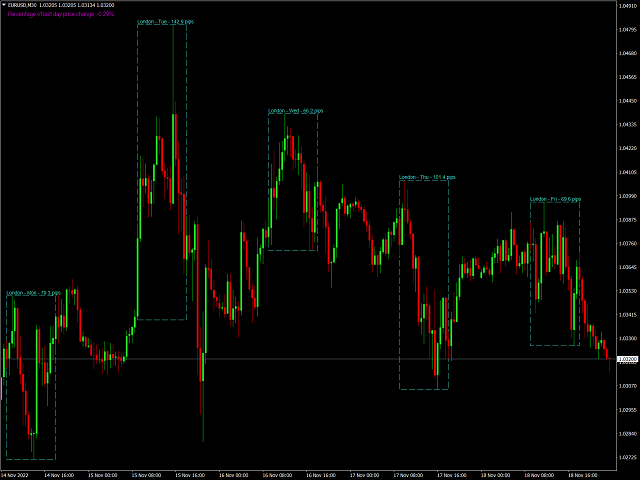
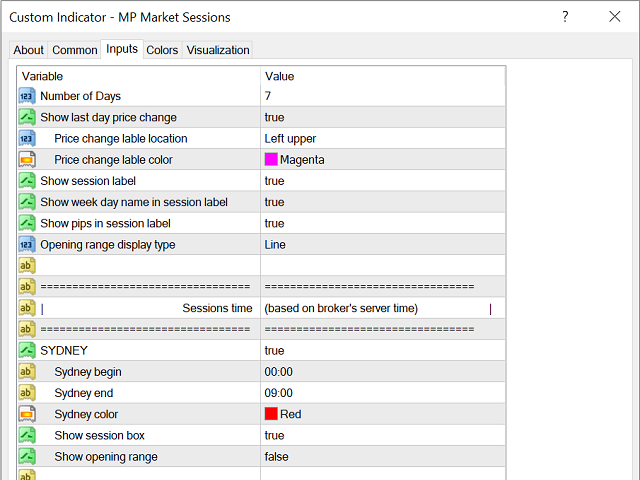
This indicator helps to identify market sessions, It's High/Low, Open Range (OR), range of the sessions in pips and percentage of previous day (change%) under OHLC.
It is also editable for any brokerage market watch time. For traders who use session trading strategies such as Mark B. Fisher ACD it can be super effective, where they can edit OR from the settings to either line or box.
- We tried to make the settings easier to edit, for traders' use on different markets, charts and brokerage time.
Please note, Dear Trader; This indicator works on 1 minute up to 30 minutes chart. For any further update we would like to have reviews from your side. You can always contact me via my Twitter linked on my profile.
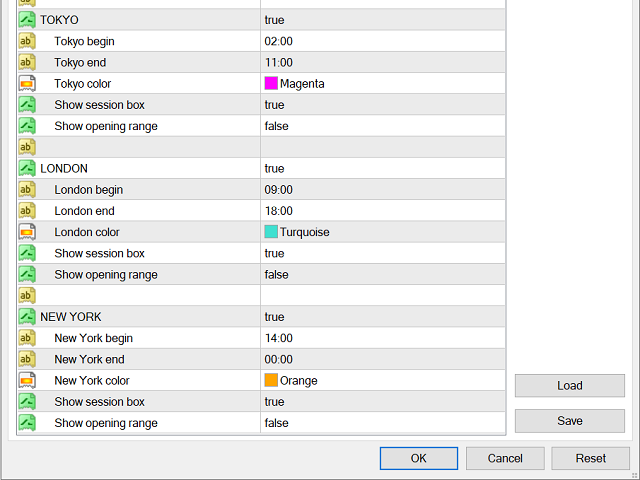
General Infor : The forex market is decentralized and driven by local sessions, four in particular—Sydney, Tokyo, London, and New York. Trading volume varies from one session to another, although the highest trading volume tends to occur when the London and New York sessions overlap.
New York: 8 a.m. to 5 p.m. (EST)
Tokyo: 7 p.m. to 4 a.m. (EST)
Sydney: 3 p.m. to 12 a.m. (EST)
London: 3 a.m. to 11 a.m. (EST)
___________________________________________________________________________________
Disclaimer:
Do NOT trade or invest based upon the analysis presented on this channel. Always do your own research and due diligence before investing or trading. I’ll never tell you what to do with your capital, trades or investments. I’ll also never recommend for you to buy, sell, long or short any asset, commodity, security, derivative or cryptocurrency related instrument as it's extremely HIGH RISK! You should always consult with a professional/licensed financial adviser before trading or investing in any type of assets.