SMT Divergences MT5
- インディケータ
- Diego Arribas Lopez
- バージョン: 1.30
- アップデート済み: 17 11月 2022
- アクティベーション: 5
SMT Divergences MT5
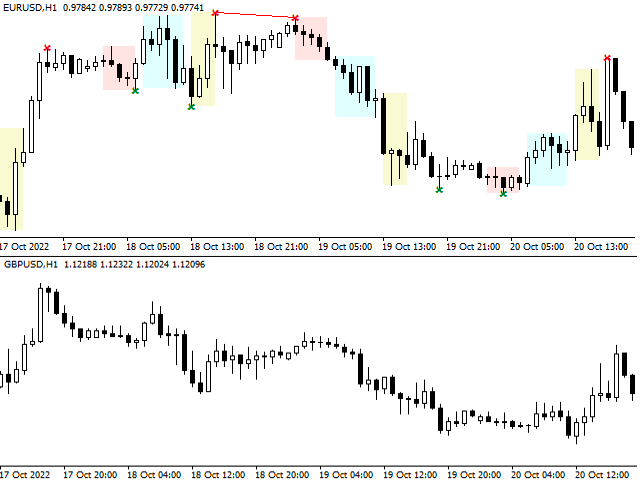
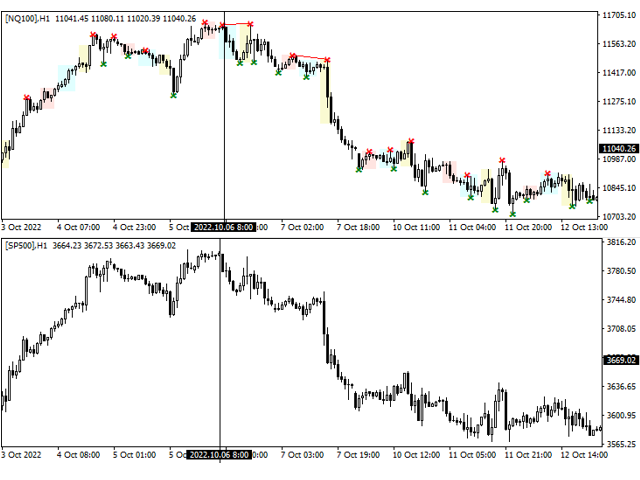
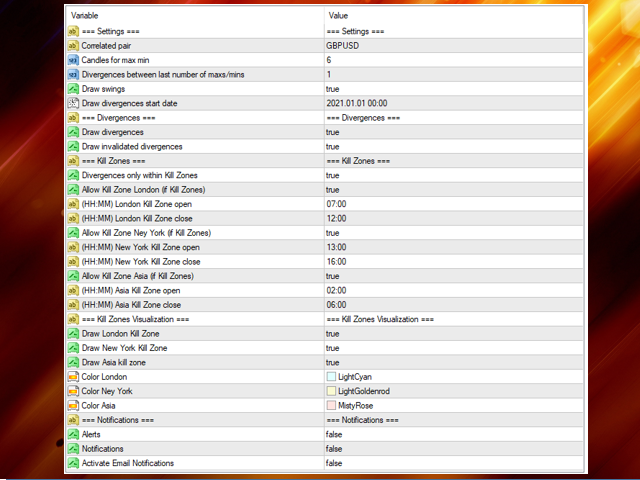
SMT Divergences is one of the most innovative indicators in the market. It offers the possibility of analyzing price divergences between 2 pairs. These divergences highlight and help to foresee what banks and institutions are planning to do. SMT divergences also provides you with a kill zones indicator and the possibility of filtering divergences occurring during these kill zones.
This indicator is specially powerful if applied in 2 highly correlated pairs. A price divergence could indicate the liquidity inflow/outflow in one of the pairs, foreseeing a possible upcoming inflow/outflow in the second one.When used correctly, SMT Divergences provide a unique perspective on the market and offer information that many traders may not be aware of.
It also includes a sophisticated alerts and notifications system that will automatically inform you when divergences are taking place.
The main characteristics of the indicator are the following:
- Time saving
- Highly customizable
- Indicates price divergences between 2 pairs
- Functional on all pairs (Cryptos, Forex, Stocks, Indices, Commodities, etc.)
- Perfect for Scalping or Swing trading
- Highlights possible market reversal zones
- Highlights banks and institutions activity
- Sophisticated alerts and notifications system