Dashboard and Scanner for MFI
- インディケータ
- Elmira Memish
- バージョン: 1.0
- アクティベーション: 5
Scanner and Dashboard for Money Flow Index MT5
The Money Flow Index (MFI) is a technical oscillator that uses price and volume data for identifying overbought or oversold signals in an asset. It can also be used to spot divergences which warn of a trend change in price. The oscillator moves between 0 and 100.
Advantages of the Scanner:
- Full Alert Options.
- Multi Timefrare
- Works for all instruments including Currencies, Indices, Commodities, Cryptocurrencies and Stocks.
- Fully customisable display options.
- No Repaint
- User defined levels.
There are different ways of using Money Flow Index oscillator.
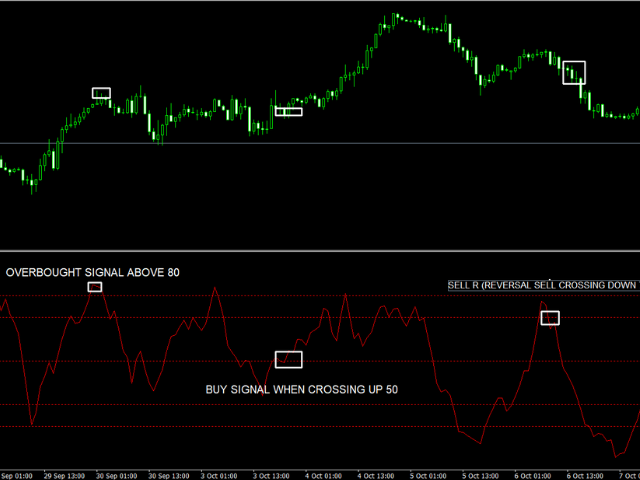
The Money Flow Index (MFI) is a technical indicator that generates overbought or oversold signals using both prices and volume data. An MFI reading above 80 is considered overbought and an MFI reading below 20 is considered oversold, although levels of 90 and 10 are also used as thresholds.
- A divergence between the indicator and price is noteworthy. For example, if the indicator is rising while the price is falling or flat, the price could start rising.
- Breakout of median line ( value ) for buy and sell.
- Breakout of overbought / oversold levels as a reversal signal.
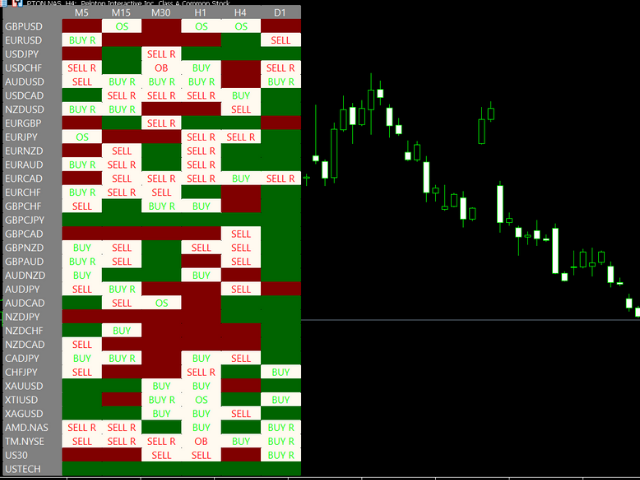
Our Scanner / Dashboards displays 3 different kind of signals.
1. Breakout of the median line. ( Signals are displayed as " BUY" OR "SELL" )
2. Signals for overbought or oversold levels. ( Signals are displayed as "OB" OR "OS")
3. Signals for reversals. When the price of the instrument hits overbought/oversold and reverses. ( Signals are displayed "BUY R" OR "SELL R"
INPUTS:
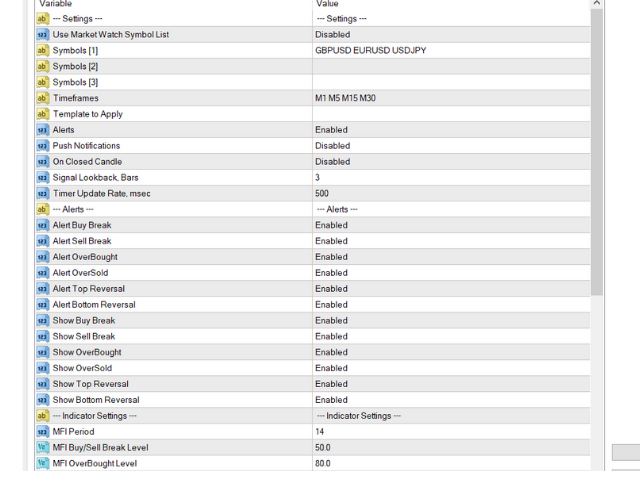
Market Watch : True/False ( If true, symbols in the market watch will be scanned )
if Market Wacth is "False""
Symbols 1 , 2 and 3 : GBPUSD EURUSD USDJPY ( Leave a blank between the pairs. Max 15 symbols for each Symbols Raw)
Timeframes: M1 M5 M15 M30 H1 H4 D1 W1 MN1 ( You can choose the TF and enter manualy. Leave a blank between the TFs)
On Closed Bar: If "Enabled", the indicator waits for the bar close to send signal.
Signals look back bars: No of the bars to keep the signal on the dashboard.
Timer Update Rate ( Miliseconds) : Refreshing/rescanning period in miliseconds
Template to Apply: When you click on the cell, chart will be opened with your template.
Alerts: Desktop and Mobile alerts can be activated.
DISPLAY OPTIONS:
BULL CELL COLOR ( IF THE VALUE IS ABOVE 50 AND NO SIGNAL ON THE CELL)
BEAR CELL COLOR ( IF THE VALUE IS BELOW 50 AND NO SIGNAL ON THE CELL)
SIGNAL BUY COLOR
SIGNAL SELL COLOR
NO. OF BARS TO KEEP SIGNAL ON THE CELL
CELL COLOR WHEN THERE IS A SIGNAL DISPLAYED ON THE CHART


