YouTubeにあるマーケットチュートリアルビデオをご覧ください
ロボットや指標を購入する
仮想ホスティングで
EAを実行
EAを実行
ロボットや指標を購入前にテストする
マーケットで収入を得る
販売のためにプロダクトをプレゼンテーションする方法

Unfortunately, "MarketPatroller" is not available for purchasing anymore.
If you have purchased this product before, you can continue using it without any limitations and install new copies as longs as you have activations left:
- Open your MetaTrader 4 terminal.
- Specify your MQL5.community account credentials in the settings: menu Tools\Options\Community.
- Go to the "Market" tab and then to the "Purchased" tab.
- Click "Install" button located to the right of the product name.
For more information, please see the documentation.
Check out other MetaTrader 4 apps

10 部中 3 部のみ残り 399 ドルです! その後、価格は 499 ドルに引き上げられます。
- REAL SIGNAL(6 か月以上アクティブな Real Signal): デフォルト設定: https://www.mql5.com/en/signals/2276213 Gold Scalping AI は人工知能を使用する EA です多くの指標のデータを分析する技術。そこから、EA は注文を入力するための最適なオプションを持つことになります。Gold Scalping AI の最大の違いは、EA が他の EA よりもはるかに優れたリスク/報酬比を制御できることです。これは、エントリ ポイントを制御し、オープン オーダーを管理するための一連のツールのおかげで可能になりました。EA はすべての注文にストップ ロスを使用し、危険な取引方法は使用しません。グリッド、マーチンゲールなどはありません... Gold Scalping AI は私が使用している EA の 1 つです。長年にわたってファンド管理アカウントを使用して取引しています。EA の最も最適化されたバージョンを正式にリリ

The GBPUSD Robot MT4 is an advanced automated trading system meticulously designed for the specific dynamics of the GBP/USD currency pair. Utilizing advanced technical analysis, the robot assesses historical and real-time data to identify potential trends , key support and resistance levels, and other relevant market signals specific to GBP/USD. The Robot opens positions every day, from Monday to Friday, and all positions are secured with Take Profit, Stop Loss, Trailing Stop, Break-Even

Introducing our advanced Scalping Forex Robot , specifically designed to maximize trading opportunities with 5 popular currency pairs on the M1 timeframe. The scalping algorithm is built to spot high-probability entry and exit points, ensuring that every trade is executed with the highest chance of success within the M1 timeframe . This robot is perfect for traders who prefer the scalping method and want to take advantage of rapid price movements without having to manually monitor the ch

ご紹介 Quantum Empire EA は 、有名な GBPUSD ペアの取引方法を変革する画期的な MQL5 エキスパート アドバイザーです。 13年以上の取引経験を持つ経験豊富なトレーダーのチームによって開発されました。
IMPORTANT! After the purchase please send me a private message to receive the installation manual and the setup instructions.
***Quantum Emperor EA を購入すると、Quantum Wizard、Quantum StarMan、または Quantum Gold Emperor を無料で手に入れることができます!*** 詳細については個別にお問い合わせください。 新しい Live Signal V5: ここをクリック
MT5バージョン: ここをクリック 量子EAチャネル: ここをクリック
10 回購入するごとに価格が 50 ドル上がります。最終価格 1999 ドル
クォンタムエ

The Bitcoin Robot MT4 is engineered to execute Bitcoin trades with unparalleled efficiency and precision . Developed by a team of experienced traders and developers, our Bitcoin Robot employs a sophisticated algorithmic approach (price action, trend as well as two personalized indicators) to analyze market and execute trades swiftly with M5 timeframe , ensuring that you never miss out on lucrative opportunities. No grid, no martingale, no hedging, EA only open one position at the sa

CyNera:あなたの取引、私たちの技術
シグナル >400%: CyNera シグナル >500%: CyNera Turbo
マニュアルとセットファイル: 購入後にご連絡いただければ、マニュアルとセットファイルをお送りします 価格: 価格は販売されたライセンスの数に応じて上昇します 利用可能なコピー: 4 金取引は、市場で最も変動の激しい金融商品であり、精密さ、徹底した分析、そして強力なリスク管理が求められます。CyNeraエキスパートアドバイザーは、これらの要素を巧みに組み合わせ、最適な金取引を実現するために設計された高度なシステムです。CyNeraの高度な戦略と技術は、経験豊富なトレーダーだけでなく、初心者にも、金取引がもたらす独自の課題やチャンスを乗り越えるための支援を提供します。 CyNeraは、金市場の複雑さに対応した信頼できるソリューションを提供します。適応性に優れたインテリジェントな戦略と、多時間枠分析、自動取引調整、そして正確なリスク管理などの高度な機能を組み合わせています。この柔軟性により、CyNeraは市場の急速な変化に即座に対応しつつ、長期的に資本を守る

ChatGPT TurboによるAI駆動テクノロジー Infinity EA は、GBPUSD および XAUUSD 向けに設計された高度な取引エキスパート アドバイザーです。安全性、一貫したリターン、無限の収益性に重点を置いています。マーチンゲールやグリッド取引などの高リスク戦略に依存する他の多くの EA とは異なり、Infinity EA は、機械学習に組み込まれたニューラル ネットワーク、ChatGPT の最新バージョンによって提供されるデータ分析 AI ベースのテクノロジーに基づく、規律ある収益性の高いスキャルピング戦略を採用し、全体的な取引体験を卓越したものにします。 6,000 人を超えるメンバーが参加する MQL5 コミュニティ に参加して、他のトレーダーとつながりましょう。最新の製品アップデート、ヒント、独占コンテンツを常に入手しましょう。 MT5バージョン Infinity EAの設定方法 特徴
Infinity EA は AI 主導のスキャルピング戦略を活用します。 EA はリアルタイムのデータ分析のために ChatGPT-4 Turbo と統合されています。 I

EA Gold Stuffは、金取引のために特別に設計されたExpert Advisorです。 この作業は、ゴールドスタッフインジケーターを使用した注文の開始に基づいているため、アドバイザーはトレンドに従うことを意味する"トレンドフォロー"戦略に従って動作します。
重要! 指示とボーナスを得るために購入後すぐに私に連絡してください! トレンド スキャナーの強力なサポートを利用して、無料のインジケーターを入手し、プライバシーを守ります。あーみー! リアルタイムの結果はここで見ることができます
パラメータ
新しいシリーズを開く-新しいシリーズの注文の開始をオン/オフします。 開始ロット-開始ロット。 トレードバイ-Expert Advisorが購入できるようにします。 トレード売り-Expert Advisorが売ることを許可します。 ヘッジを使用する-機能が有効になっている場合、アドバイザーは買いと売りの両方の方向を取引し、機能が無効になっている場合、アドバイザーは一方向 マネー Manadgementを使用-オン/自動ロット計算の使用をオフにします。 オートロットオー

総合的なアプローチのエッセンスであり、その主要な目標は、トレーダーにとってリスクを最小限に抑えながら長期的かつ現実的な収益を得ることです。基盤は、先進的なトレーディングの概念と機械学習を組み合わせたもので、これらが効果的に相互に強化し合います。もう一つのユニークな特徴は、システムを最適化する必要がないという点で、これは私のサーバーが担当しています。最新の設定は毎日私たちのTelegramチャンネルで公開されており、常にシステムの関連性を最高レベルに維持しています。 私たちの Telegram コミュニティ 貿易監視 !!! MetaTrader 5 用バージョン !!! MetaTrader 4 用の無料(ライト)バージョン 設置と操作のマニュアル なぜこのアドバイザーを購入する必要があるのか、 特に触れたいと思います 。無料版がオリジナルとほぼ同じものと思われがちですが、そうではありません。無料版では、デモ機能のみが組み込まれており、すべての設定は自分で選び出す必要があります。それは私が時折公開するものから選ぶものです。静的な設定はすぐに陳腐化します。つまり、有料版では、さまざ

AI Golden Jet Fighter GTX MT4 は、Meta Trader 4 プラットフォームでの金取引用のシンプルで効率的なエキスパート アドバイザー (EA) です。ニューラル ネットワークを利用して、この EA は金市場 (XAU/USD) でのスキャルピング用に設計されています。AI Golden Jet Fighter GTX の主な戦略は、小さな価格変動を特定し、ポジションを開いて短期間で利益を獲得することに重点を置いています。EA は市場の状況をリアルタイムで分析し、事前に定義されたストップロス レベルとテイクプロフィット レベルで取引を自動的に実行します。また、トレーリング ストップ機能もサポートしているため、市場が有利に動いたときにトレーダーは利益を確定できます。正確性を確保するために、EA はスプレッド フィルターを使用して不利な条件での取引を回避し、スリッページ保護メカニズムを使用して正確な注文を実行します。AI Golden Jet Fighter GTX にはリスク管理機能が含まれており、トレーダーはリスク レベルをアカウント残高のパー

Aura Neuron は、Aura シリーズのトレーディング システムを引き継ぐ独特のエキスパート アドバイザーです。高度なニューラル ネットワークと最先端のクラシック トレーディング戦略を活用することで、Aura Neuron は優れた潜在的パフォーマンスを備えた革新的なアプローチを提供します。完全に自動化されたこのエキスパート アドバイザーは、EURUSD や XAUUSD (GOLD) などの通貨ペアを取引するように設計されています。1999 年から 2023 年まで、これらのペアで一貫した安定性が実証されています。このシステムは、マーチンゲール、グリッド、スキャルピングなどの危険な資金管理手法を回避しているため、あらゆるブローカーの条件に適しています。Aura Neuron は、多層パーセプトロン (MLP) ニューラル ネットワークを搭載しており、これを利用して市場のトレンドと動きを予測します。MLP はフィードフォワード人工ニューラル ネットワーク (ANN) の一種で、特に単一の隠し層で構成されている場合は「バニラ」ニューラル ネットワークと呼ばれることがよくあります。

Gann Made Easy は、ミスター・ギャンの理論を使用した取引の最良の原則に基づいた、プロフェッショナルで使いやすい外国為替取引システムです。 W・D・ガン。このインジケーターは、ストップロスとテイクプロフィットレベルを含む正確な買いと売りのシグナルを提供します。 PUSH通知を利用して外出先でも取引可能です。 購入後はご連絡ください!私の取引のヒントと素晴らしいボーナスインジケーターを無料で共有します! おそらく、ギャンの取引手法についてはすでに何度も聞いたことがあるでしょう。通常、ギャンの理論は初心者のトレーダーだけでなく、すでにある程度の取引経験がある人にとっても非常に複雑なものです。なぜなら、ギャンの取引手法は理論的にはそれほど簡単に適用できるものではないからです。私はその知識を磨き、最良の原則を私の外国為替インジケーターに組み込むために数年を費やしました。 このインジケーターは非常に簡単に適用できます。必要なのは、それをチャートに添付し、簡単な取引推奨事項に従うだけです。このインジケーターは常に市場分析の仕事を行い、取引の機会を探します。適切なエントリーポイントを検出

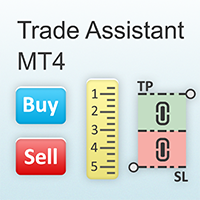
取引 ごとのリスクの 計算、新規注文 の 簡単 な 設置、部分的 な 決済機能 を 持 つ 注文管理、 7 種類 のトレーリングストップなど 、便利 な 機能 を 備 えています 。
追加の資料と説明書
インストール手順 - アプリケーションの手順 - デモアカウント用アプリケーションの試用版
ライン機能 チャート上にオープニングライン、ストップロス、テイクプロフィットを表示します。この機能により、新規注文を簡単に設定することができ、注文を出す前にその特徴を確認することができます。 リスク計算 リスク計算機能は、設定されたリスクとストップロス注文のサイズを考慮して、新規注文のボリュームを計算します。ストップロスの大きさを自由に設定できると同時に、設定したリスクを守ることができます。 Lot calc ボタン - リスク 計算 を 有効 / 無効 にします 。 Risk フィールドでは 、必要 なリスクの 値 を 0 から 100 までのパーセンテージまたは 預金通貨 で 設定 します 。 設定」 タブで 、 リスク 計算 の 種類 を 選択 します :「 $ 通貨」、「 % 残

WINTER Mega SALE! --> Buy Forex GOLD Investor with -60% OFF and get a BONUS EA -> Pips Master PRO - with amazing results!
NOTE: Promo price: $197 (Regular Price: $497) - The offer ends soon! Live Signal Account: https://www.mql5.com/en/signals/2276118 Forex GOLD Investor is one of the best expert advisors developed to trade on GOLD(XAUUSD) in the forex market. Forex GOLD Investor consists of 2 trading systems . The first one is based on scalping trading strategy and the second system has time

需要と供給の 原理に基づいた 完全自動アドバイザー 。完全に自動化された 需要と供給のアドバイザー を初めて提供しました 。 取引が 簡単に なり、取引戦略を完全にコントロールできるようになりました 便利なグラフィカル操作パネルを使用。 15,000 行を超えるコードを含む、非常に高品質の アルゴリズム取引 ソフトウェアが手に入ります。
EA ProBot の需要と供給のガイド
Prop Firms を取引するための最良の方法は、資格のあるトレーダーになるためのすべての手順に挑戦します。
すべてのトランザクションは自動的に行われ、管理されます。 インプットを選択する だけで、リラックスして利益の成長を観察できます。
パネル入力パラメータ:
取引方向の 選択 (買いまたは売り) 取引したい時間枠 を選択してください 操作したいゾーンのタイプ を選択します (広、中、狭、超狭)
3つの資金管理オプション から選択 利益を得る取引 または 損失を得る 取引の数の後に停止するアドバイザーを選択してください 。 リスクまたは ATR に基づいて TP および SL オッズを選択しま

43% off for 48 hours only (Original price: $1,595) 50% bonus by purchasing this Robot, Contact us "after purchase" to receive the bonus
A fully automatic expert
Designed and produced 100% by artificial intelligence, with the world's most advanced technology
All trades have profit and loss limits, with the best and least risky market strategy, without using dangerous strategies such as Martingale and hedges, etc.
A specialist who has been trained by artificial intelligence for years to correctl

Trade Manager EAへようこそ。これは、取引をより直感的、正確、そして効率的にするために設計された究極の リスク管理ツール です。これは単なるオーダー実行ツールではなく、包括的な取引計画、ポジション管理、リスク管理のためのソリューションです。初心者から上級者、迅速な実行を必要とするスキャルパーまで、Trade Manager EAはあらゆるニーズに対応し、為替、指数、商品、暗号通貨などさまざまな市場で柔軟に対応します。 Trade Manager EAを使用すると、複雑な計算が過去のものになります。市場を分析し、エントリーポイント、ストップロス、テイクプロフィットのレベルをチャート上のラインでマークし、リスクを設定するだけで、Trade Managerが最適なポジションサイズを即座に計算し、SLとTPをピップ、ポイント、口座通貨でリアルタイムに表示します。すべての取引が簡単かつ効果的に管理されます。 主な機能: ポジションサイズ計算機 :定義されたリスクに基づいて取引サイズを瞬時に決定します。 簡単な取引計画 :エントリー、ストップロス、テイクプロフィットを設定するためのド

HFT Prop Firm EAは、その独特のロゴからGreen Manとも呼ばれており、高頻度取引(HFT)戦略を許可するプロプライエタリトレーディング会社(prop firms)の課題や評価を克服するために特別に作成されたエキスパートアドバイザー(EA)です。 期間限定:HFT Prop Firm EAを購入すると、$198相当の無料ユーティリティがもらえます MT5バージョン: https://www.mql5.com/en/market/product/117386 HFTチャレンジパフォーマンスモニター($200から開始): ブローカー:IC Markets アカウント番号:66603384 サーバー:ICmarketsSC-Demo06 パスワード:Greenman ブローカー:IC Markets アカウント番号:21718043 サーバー:ICmarketsSC-Demo02 パスワード:Greenman 結果1: https://c.mql5.com/31/1055/hft-prop-firm-ea-screen-4333.gif 結果2: https://c.mq

EvoTrade: 市場初の自己学習型トレーディングシステム EvoTradeをご紹介します。これは、最新のコンピュータービジョンとデータ分析技術を駆使して開発されたユニークなトレーディングアドバイザーです。市場初の自己学習型トレーディングシステムであり、リアルタイムで稼働します。EvoTradeは市場状況を分析し、戦略を調整し、変化にダイナミックに適応することで、あらゆる環境で卓越した精度を実現します。 EvoTradeは、Long Short-Term Memory(LSTM)やGated Recurrent Units(GRU)といった高度なニューラルネットワークを活用して時間的依存性を分析し、畳み込みニューラルネットワーク(CNN)を使用して複雑な市場パターンを検出します。また、Proximal Policy Optimization(PPO)やDeep Q-Learningなどの強化学習アルゴリズムを使って、リアルタイムで戦略を適応させます。これらの技術により、EvoTradeは市場の隠れたシグナルを見つけ出し、現在の市場ダイナミクスに正確に対応します。 各トレード後、Evo

Gold Scalping Expert は、地政学的なニュース、パンデミック、経済変動などのさまざまな影響の大きいイベント中の金の反応を利用する、非常にインテリジェントなスマート アルゴリズムです。 このシステムは、人気のジグザグ指標を使用して転換点で未決注文を発注することでブレイクアウト取引を行い、価格がこれらのレベルを超えてブレイクアウトすると注文がトリガーされます。 EA は非常にスマートなトレーリング ストップとダイナミック ストップロスを使用して、マーチンゲール手法を使用せずにアカウントを保護し、リスクを適切に管理します。 リアルタイムの結果はここで確認できます。 個人ボーナスを獲得するには、購入後すぐにご連絡ください。 設定・マニュアルはこちら 設定 Open new series - オン / オフ 新しい一連の注文の開始 Trade Buy - アドバイザーに購入を許可する Trade Sell - アドバイザーに販売を許可する Support manual orders - 手動注文の真偽をサポートします Max Orders - 許可される最大注文数 Max

Golden Lab AI is quite a unique trading system: It operates 100% based on technical analysis. It can integrate fundamental analysis related to deposit interest rates (channel rate mode). For the channel rate mode, you need to contact me before purchasing it. Flexible SL - TP. Single orders only, with no high-risk trades like grid or martingale. Default SL is only 2%. Trades are carefully selected and combined with daily interest rates to determine the main trend, which results in fewer trades—av

Dynamic Forex28 Navigator - 次世代の Forex 取引ツール。 現在 49% オフ。
Dynamic Forex28 Navigator は、長年人気のインジケーターを進化させたもので、3 つの機能を 1 つにまとめています。 Advanced Currency Strength28 インジケーター (レビュー 695 件) + Advanced Currency IMPULSE with ALERT (レビュー 520 件) + CS28 コンボ シグナル (ボーナス)。
インジケーターの詳細 https://www.mql5.com/en/blogs/post/758844
次世代の Strength インジケーターが提供するもの オリジナルで気に入っていたすべての機能が、新機能と精度の向上によって強化されました。
主な機能: 独自の通貨強度計算式。 すべての時間枠でスムーズかつ正確な強度ライン。 トレンドの特定と正確なエントリーに最適です。
ダイナミックマーケットフィボナッチレベル (マーケットフィボナッチ)。 このインジケーターに固有

Expert Advisor は、不採算ポジションを回復するために設計されたシステムです。 著者のアルゴリズムは、負けポジションをロックし、それを多くの別々の部分に分割し、それぞれを別々に決済します。簡単なセットアップ、ドローダウンの場合のローンチ遅延、ロック、他の Expert Advisor の無効化、トレンド フィルタリングによる平均化、負けポジションの部分決済が 1 つのツールに組み込まれています。 グループ全体でのみ注文をクローズするグリッド戦略とは対照的に、より低い預金負荷で損失を減らすことができ、損失をより安全に処理できるようにするのは、部分的に損失をクローズすることです。 注文が復元される方法: 1 EA は、選択した商品の他のウィンドウを閉じて、不採算の EA をオフにします (オプション)。 2 EA は、処理されたすべての注文のテイクプロフィットとストップロスのレベルをリセットし、対応する識別子を持つ保留中の注文を削除します。 3 EA は、利益を利用して不採算注文の一部をカバーし、総ポジション量を減らすために、すべての処理された採算性のある注文をクローズします

概要 CoreX G EAは、外国為替市場の複雑さに対応するために特別に設計された高度な取引システムです。最先端のニューラルネットワーク、高度な機械学習技術、および統合されたビッグデータ戦略を活用することで、CoreX Gは取引において卓越した精度とセキュリティを提供します。このエキスパートアドバイザー(EA)は、技術的な優秀さとプレミアムなカスタマーサポートにより際立ち、ユーザーが質問や懸念に常に対応できるようサポートします。
信号: Live Signal Live Signal 2 Blog: CoreX G EA この戦略は非常にユニークなので、ライセンスの数を制限して販売したいと考えています。そのため、販売を制限するために価格は着実に上昇します。 次の価格は 790米ドル です 。 ブローカー 任意のブローカー、 ECN / ZERO スプレッドを推奨 レバレッジ 1:20 から 入金 最低 200 ドル シンボル XAUUSD タイムフレーム H1
ビッグデータ統合と取引戦略 ビッグデータはCoreX Gの戦略の基盤です。膨大な量の過去およびリアルタイム

The AI Gen ProX Expert Advisor is a powerful solution based on advanced market analysis and data processing technologies. Utilizing cutting-edge algorithms for time series analysis and complex mathematical models, it ensures high accuracy in forecasts and automates trading processes. The EA is designed to combine performance and reliability, making it an effective tool for trading. Real Time Signal GEN PRoX: https://www.mql5.com/ru/signals/2283186 The price of the advisor will increase si

The Matrix Mind AI: 外国為替取引の新基準 The Matrix Mind AIは、外国為替市場での可能性を拡大するために設計された革新的な取引アドバイザーです。行列分解モデルに基づいて、市場データを深く分析し、隠れたパターンを発見し、戦略開発のためのユニークな機会を提供します。 リアルシグナル:
https ://www .mql5 .com /en /signals /2277247 価格オファー: 最初の7コピー: $399 次の価格: $499 The Matrix Mind AIの主な特徴 行列分解を基盤とする分析 特異値分解(SVD)や主成分分析(PCA)などの高度なアルゴリズムを活用し、大規模なデータセットを分解して、通貨ペア、時系列、市場動向間の重要な相関関係を特定します。 テキストおよびグラフィックAIとの明確な違い テキスト分析やデータの可視化に限定されるプラットフォームとは異なり、The Matrix Mind AIは実際の市場条件に合わせて設計されています。そのアルゴリズムは複数の要因を考慮し、より正確で関連性の高い洞察を提供します。

EA Gold Isis – 安全で効果的な金取引ソリューション \ ローンチプロモーション 現在の価格で残りわずか3本 次回価格:$458 最終価格:$1998 ライブシグナル MT5バージョン こんにちは。私はEA Gold Isis、Diamond Forex Groupファミリーの2番目のEAで、金(XAU/USD)取引専用に設計されています。優れた機能と安全性を重視した設計で、トレーダーの皆様に持続可能で効果的な金取引体験を提供します。
EA Gold Isisの特徴
- 動的ストップロス(SL):EAは、最近のローソク足の価格範囲に基づいてストップロスを設定します。これにより、SLが市場の状況に柔軟に対応し、変動する市場でも効果的に口座を保護します。
- 多様な取引戦略:EAには3つの取引戦略が搭載され、それぞれ最大3つのポジションを同時に開くことができます。合計で最大9つの取引が可能です。
- 柔軟なトレーリングストップ:トレーリングストップによる利益確保機能が含まれています。この機能は、個々の好みに応じてカスタマイズ可能です

ビットコイン ボット
Btc ボットはストキャスティクス テープ インジケーターを使用し、ビットコインの取引専用に設計されていますが、必要に応じて他の通貨ペアの取引もできます。テープが赤から緑に交差すると、EA は買いを開始し、緑から赤に交差すると、EA は売りを開始します。取引は、利益確定に達するまでマーチンゲール/グリッド スタイルで制御されます。EA にはニュース フィルターが組み込まれており、設定に応じてニュースの前の特定の時間に新しいポジションの入力を停止します。
ペアと時間枠: m15 の btcusd で使用 m15 の xauusd または eurusd、gbpusd、usdcad、audusd などの主要通貨ペアで使用できます
ニュース設定: [ツール]、[オプション]、[エキスパート アドバイザー] に移動し、[リストされた URL の WebRequest を許可する] チェックボックスをオンにしてください。次の URL を追加します: https://sslecal2.investing.com/ https://www.worldtimeserver.

EAブラックドラゴンはブラックドラゴンインジケーターで動作します。エキスパートアドバイザーはインジケーターの色で取引を開始し、注文のネットワークを構築したり、ストップロスで作業したりすることができます。
実際の作業の監視、およびその他の開発については、https:// www.mql5.com/en/users/mechanic/sellerを参照してください 。
ここですべての設定を見つけることができます!推奨事項
通貨ペアEURUSDGBPUSD 時間枠M15 推奨保証金1000ドルまたはセント 推奨設定デフォルト設定入力パラメータ 初期ロット-初期ロット; ロット乗数-後続の注文のロット乗数。 自動ロット-自動ロット計算を有効/無効にします。 自動ロットサイズ-自動ロットが有効になっている場合にアドバイザーがロットを使用するデポジットの金額。 距離-注文間の距離。 最大ロット-アドバイザーが開くことができる最大ロット。 利益を得る-利益を得る; ストップロス-ポイントでストップロス。 トレイルスタート-トレーリングストップがアクティブ化されたポイントでの利益。

1 copy left for $199. Next price --> $299. Diamond PRO is enhanced powerful version of Diamond for advanced traders. Pro version includes optimized cores, new impoved entry points filters, new multistage profit closure algorithm and сontains number of external control parameter that allows build and fine tune own tradind decisions and algorithms. The system provides more accurate market entries, analyzes and filters upcoming economic news, contains spread protection and an advanced position ma

CyNeron: 精密な取引とAIイノベーションの融合 シグナル : CyNeron マニュアルと設定ファイル : 購入後にお問い合わせいただければ、マニュアルと設定ファイルをお送りします 価格 : 販売されたコピー数に応じて価格が上昇します 利用可能なコピー : 5 AI駆動のスナップショット分析:市場初 CyNeronは、市場で初めて高度なAIを革命的な取引アプローチに統合したEAであり、
市場状況の詳細なスナップショットをキャプチャして処理します。
最先端のAI対応ニューラルネットワークを利用して価格データと技術指標を評価し、
市場の動きを高精度に予測して、正確かつ戦略的な取引決定を可能にします。 このAI駆動技術はCyNeronを際立たせ、リアルタイムで進化する市場動向に動的に適応し、
これまで得られなかった洞察をトレーダーに提供します。
シンボル XAUUSD (ゴールド) 時間枠 M15またはM30 資本 最低 $100 ブローカー 任意のブローカー 口座タイプ 任意、スプレッドが低いものが推奨 レバレッジ 1:20以上 VPS 推奨されますが必須ではありません

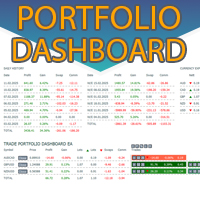
日ごとおよび週ごとのクローズ取引履歴、現在のオープン取引、および外国為替エクスポージャーを 1 つのチャートで即座に確認できます。ヒートマップを使用して、収益性の高い取引と、取引ポートフォリオ内の現在のドローダウンの位置を特定します。
クイック クローズ ボタン クイック クローズ ボタンを使用すると、1 つのシンボルのすべての取引をクローズしたり、個々の取引を完全にクローズしたり、ボタンをクリックするだけで部分的な利益または損失を取得したりできます。リストで取引を探したり、取引の一部をクローズする方法を考えたりする必要はもうありません。ダッシュボードには、外国為替ペアの取引中に各通貨シンボルの現在のエクスポージャーも表示されるため、主要なニュース イベントの前にエクスポージャーが過剰になっている可能性のある領域を特定するのに役立ちます。ボタンを使用して、ニュースの前にエクスポージャーを即座にすばやく減らすことができます。または、ニュースがすでに発生して利益が出ている場合は、1 回のクリックでその利益をすばやく銀行に預けることができます。
オープン取引ヒートマップ 取引ヒートマッ

Gold Venamax - これは最高の株式テクニカル指標です。 指標アルゴリズムは資産の価格変動を分析し、ボラティリティと潜在的なエントリーゾーンを反映します。
インジケーターの機能:
これは、快適で収益性の高い取引のためのマジックとトレンド矢印の 2 つのブロックを備えたスーパー インジケーターです。 チャート上にブロックを切り替えるための赤いボタンが表示されます。 マジックはインジケーター設定で設定されているため、異なるブロックを表示する 2 つのチャートにインジケーターをインストールできます。 Gold Venamax は、異なる矢印バッファー (GV と SD) を備えた 2 つのチャートに配置できます。 これを行うには、設定で異なる Magic を選択する必要があります。たとえば、あるマジック = 999、別のマジック = 666 を選択します。次に、チャート上の赤いボタンで矢印バッファを選択できます。 入力するのに最適な信号 = 両方のバッファ (GV および SD) の信号矢印 + 3 本すべての MA ライン (赤または青) の方向に従います + TMA

Local Trade Copier EA MT4 による、驚くほど高速な取引コピーを体験してください。1分で簡単にセットアップできるこの取引コピー機は、同じWindowsコンピュータまたはWindows VPS上の複数のMetaTrader端末間で取引をコピーすることができ、0.5秒未満の高速コピースピードを実現します。
初心者であろうとプロのトレーダーであろうと、 Local Trade Copier EA MT4 には、あなたの特定のニーズに合わせてカスタマイズするための幅広いオプションが用意されています。これは、利益の可能性を高めたい人にとって究極のソリューションです。 今すぐ試してみて、これが市場で最も速くて簡単なトレードコピー機である理由を理解してください。 ヒント: デモアカウントで Local Trade Copier EA MT4 デモバージョンをダウンロードして試すことができます: ここ ダウンロードした無料のデモ ファイルを MT4 >> ファイル >> データ フォルダを開く >> MQL4 >> Experts フォルダに貼り付けて、ターミナルを再起動しま

- Real price is 80$ - 40% Discount ( It is 49$ now ) - Lifetime update free Contact me for instruction, add group and any questions! Related Products: Bitcoin Expert , Gold Expert - Non-repaint - I just sell my products in Elif Kaya profile, any other websites are stolen old versions, So no any new updates or support. Introduction The breakout and retest strategy is traded support and resistance levels. it involves price breaking through a previous level. The break and retest strategy is

!SPECIAL SALE! An exclusive indicator that utilizes an innovative algorithm to swiftly and accurately determine the market trend. The indicator automatically calculates opening, closing, and profit levels, providing detailed trading statistics. With these features, you can choose the most appropriate trading instrument for the current market conditions. Additionally, you can easily integrate your own arrow indicators into Scalper Inside Pro to quickly evaluate their statistics and profitability

Paradox Flux Trader:ゴールドトレーディング(XAU/USD)の革命 市場を分析するだけでなく、トレードのアプローチそのものを再定義するツールを想像してください。Paradox Flux Trader は、単なるエキスパートアドバイザー(EA)ではなく、ゴールド(XAU/USD)取引のために設計された次世代のトレードシステムです。市場のどのソリューションとも異なる独自の技術を採用しています。 期間限定オファー Paradox Flux Trader は期間限定で $499 で提供中です。プロモーション終了後、価格は倍になります。このチャンスをお見逃しなく! 残り 5 本、特別価格 $499 購入後、プライベート資料へのアクセスやセットアップサポートをご希望の方はご連絡ください。 リアルタイム取引実績: ライブ シグナル
Paradox Flux Trader のミッション Paradox Flux Trader は、ゴールドトレーディングに対する理解を根本的に変革するために開発されました。ただデータを分析するのではなく、手動では再現できない

IX Power: 指数、商品、暗号資産、外国為替市場の洞察を発見 概要
IX Power は、指数、商品、暗号資産、外国為替市場の強弱を分析するための多用途ツールです。 FX Power が全ての利用可能な通貨ペアデータを活用して外為ペアで最高の精度を提供する一方、 IX Power は基礎資産の市場データにのみ焦点を当てています。この特性により、 IX Power は非外為市場に最適であり、単純な外為分析にも信頼性の高いツールです。どのチャートでもスムーズに機能し、取引判断を向上させるための明確で実行可能な洞察を提供します。
1. IX Power がトレーダーにとって価値がある理由 複数市場での強弱分析
• IX Power は指数、商品、暗号資産、外為シンボルの強弱を計算し、それぞれの市場に合わせた洞察を提供します。
• US30、WTI、ゴールド、ビットコイン、または通貨ペアなどの資産を監視して取引機会を発見できます。 幅広い市場に適応
• 外為取引では、 FX Power が関連する全ての通貨ペアを分析することで比類のない精度を提供します。
• IX Power

Boring Pips EA 40%オフ – 限定オファー! 8回のアクティベーション をわずか**$399 USD**で入手可能 – 限定10本のみ! なぜ Boring Pips EA を選ぶのか?
実証済みの実績 – 123週間の追跡シグナルで 1000% 以上の利益
簡単インストール – 数分で開始可能
完全自動化 このチャンスを逃さず、自信を持って正確に取引しましょう! 今すぐ Boring Pips EA を入手! ほとんどのエキスパートアドバイザーがバックテストのパフォーマンスは完璧でも、実際の取引では効果的でない理由について考えたことはありますか? 最もありそうな答えは過学習です。多くの EA は利用可能な過去のデータに完璧に適応するように作成されていますが、構築されたモデルに一般化能力がないため、将来を予測することができません。 一部の開発者は、過学習の存在を知らないか、知っていても防止する方法を持っていません。他の人はそれをバックテスト結果を美化するためのツールとして利用し、統計的な有意性を考慮せずに数十の入力パラメータを追加し、

Live signal: 2 000 000$ https://www.mql5.com/en/signals/2288221 Why Bitcoin trading
1. Elite Precision Precision – Redefining Trading
Cutting-edge algorithms fine-tuned for pinpoint execution. Smart setups crafted to navigate risks and seize opportunities. 2. Adaptive Market Strategies with Real-Time Price Movement
Markets shift—but Bitcoin Robot is built to adapt instantly: Trading in trending, volatile, or ranging conditions. Captures breakouts, reversals, and price surges before they hap

EA(エキスパートアドバイザー)は、ニューヨークセッション中に市場が動き始めたとき(取引量の増加)にポジションを開きます。このようにして、取引量によってモメンタムが維持され、高い確率で即座に利益確定(Take Profit)を達成できます。 シグナル (292%, 10% DD): https ://www .mql5 .com /en /signals /2274145 ニューヨークセッション中のモメンタムに基づくエントリー EAは、低タイムフレーム上のFVG(フェアバリューギャップ)を使用して隠れたインパルスを検出します。インパルスがニューヨークセッション直前またはセッション中に検出されると、EAはポジションを開きます。 市場の動向に応じたポジション管理 モメンタムがすぐに消失した場合、EAは次の3つの戦略のいずれかを適用します: 特定の価格レベルでストップロスを発動し、取引を停止します。 ストップロスを発動し、逆方向に新しいポジションを開きます。 最初のポジションを追加や削除を行いながら管理し、利益が出るまで取引を続けます。 使用方法 購入後、設定手順の詳細について連絡してく

Yarukami Mnukakashi is an automated trading advisor designed for traders in the Forex market. The version for MT5 is located at the link. Key Features: Strategy type: 24-hour trading, but I recommend avoiding the American session and setting a daily take of $30-40 per 0.01 lot. Can work in one direction or both at once independently of each other. Trading instruments: GOLD
Timeframes: M1
Algorithm: Uses technical analysis with moving average indicators, Bollinger and Momentum.
Risk management: t

ENIGMERA: 市場の中心 重要:MQL5.comのデモはStrategy Testerで実行されており、Enigmeraの機能を完全には反映していない場合があります。詳細については、説明、スクリーンショット、ビデオをご確認ください。質問があれば、遠慮なくメッセージを送ってください! インジケーターのコードは完全に書き直されました。バージョン3.0は新機能を追加し、インジケーターの開始以来蓄積されたバグを修正しました。
紹介
このインジケーターとトレーディングシステムは、金融市場への注目すべきアプローチです。ENIGMERAはフラクタルサイクルを使用して、サポートとレジスタンスのレベルを正確に計算します。真の蓄積フェーズを示し、方向と目標を提供します。トレンドでも修正でも機能するシステムです。 動作方法
インジケーターのほとんどの機能は、チャートの左側にあるボタンで制御され、市場の状況に迅速に対応できるようになっています。 ボタン ON/OFF – インジケーター全体を表示または非表示にします。 Channel – サポートチャネルを有効にし、許容範囲の偏差を示します。 Dev

Aurum AI – 金取引(XAU/USD)のための人工知能の力 取引における技術の可能性をすべて体験してください! Aurum AI は、金市場で安定的かつ安全に運用するために設計された画期的なエキスパートアドバイザーです。人工知能の力、正確なトレンド分析、厳格なリスク管理を組み合わせて、すべての取引が最大限の効果を発揮できるようにします。 プロモーション Discount - 12%. 2 copies available at a price of $400 高リスクのライブシグナル
(最大ドローダウン20%まで) Aurum AI購入特典 – フラクタルシステムを使用するGoldPrime AIアドバイザー!
(テストを見る) Aurum AIを購入して、GoldPrime AIを無料で手に入れましょう – 市場に存在しない唯一のアドバイザーです!
Aurum AI購入者のみ利用可能です。 特典の受け取り方法 購入後にご連絡いただければ、特典をお送りいたします。
Aurum AIの主な利点: グローバルトレンドを分析: トレンド方向に厳密に従って取引を行います。 安全な方

In the volatile world of Forex trading , high-impact news events can lead to significant market movements and opportunities. News EA MT4 is a perfect Forex robot specifically designed to capitalize on these moments of market turbulence. Equipped with cutting-edge algorithms and real-time news integration, News EA MT4 offers traders the edge needed to navigate during major economic announcements. Directly linked to major financial news sources, ensuring immediate response to high-impact events. H

FX Power: 通貨の強弱を分析して、より賢い取引を実現 概要
FX Power は主要通貨と金の実際の強弱をあらゆる市場状況で理解するための必須ツールです。強い通貨を買い、弱い通貨を売ることで、 FX Power は取引の意思決定を簡素化し、高い確率の取引機会を見出します。トレンドを追従する場合でも、極端なデルタ値を使用して反転を予測する場合でも、このツールはあなたの取引スタイルに完全に適応します。ただ取引するだけではなく、 FX Power で賢く取引をしましょう。
1. なぜ FX Power がトレーダーにとって非常に有益なのか 通貨と金のリアルタイム強弱分析
• FX Power は主要通貨と金の相対的な強弱を計算し、マーケットダイナミクスに関する明確な洞察を提供します。
• どの資産がリードしているか、または後れを取っているかを監視して、取引するペアを賢く選びましょう。 マルチタイムフレームの包括的なビュー
• 短期、中期、長期のタイムフレームで通貨と金の強弱を追跡し、マーケットトレンドに基づいて取引戦略を調整できます。
• スキャルピングからスイングトレード

FX Levels: あらゆる市場における非常に高精度なサポート&レジスタンス 概要
通貨ペア、株式指数、個別銘柄やコモディティなど、どのような市場でも信頼できるサポートとレジスタンスを特定したいですか? FX Levels は伝統的な “Lighthouse” メソッドと先進的な動的アプローチを融合し、ほぼ汎用的な精度を実現します。ブローカーの実務経験を活かし、自動化されたデイリー更新とリアルタイム更新を組み合わせることで、 FX Levels は反転ポイントを見つけ、利益目標を設定し、自信をもってトレードを管理するための手助けをします。今すぐ試してみて、サポート/レジスタンス分析の正確性がどれほどトレードを向上させるかを実感してください!
1. FX Levels がトレーダーにとって非常に有用な理由 非常に正確なサポート&レジスタンスゾーン
• FX Levels は異なるブローカー環境でもほぼ同一のゾーンを生成するよう設計されており、データフィードの差異や時刻設定のずれによる不一致を解消します。
• つまり、どのブローカーを利用していても一貫したレベルが得られるため、戦

Gold One MT4 Forexのゴールドトレード愛好者の皆さん、こんにちは。 私たちのロボットへようこそ。ここでは、トップゴールドトレーダーの仲間となることができます。20年以上の精密なForex市場の経験を持つ私たちは、最新世代のトレーディングロボットを誇りを持ってご紹介します。
特徴: プロップファームチャレンジに最適です。 すべての口座サイズに対応しており、少額の資本でも使用可能です。 NO グリッドと NO マーチンゲール 100% 完全自動化 このロボットは、ゴールド専用の最新かつ最先端のインジケーターを使用しており、売買ポイントの特定において比類なき精度を誇ります。これは、Forex市場におけるゴールド取引の革命的な突破口を示しています。この革新は、10年以上にわたる研究、試行錯誤、および広範なテストの結果であり、トップゴールド取引専門家の洞察を取り入れています。複雑なゴールド取引パターンを活用することで、ロボットは完全に自動化された取引をストレスなく監視できるようにし、心の平穏を確保します。長年のテスト結果は、私たちのロボットの優れたパフォーマン

ATTENTION: Last days with the Black Friday price, take advantage and buy now, in March the price will go to 600 USD. One of the few robots with a signal history of more than 3 years, and among the top 10. LINK TO MY ROBOTS AND SIGNAL PRESETS: In my profile there is a link to download the PRESETS that I use in my SIGNALS, you can download and backtest for free, there are explanations in the README MANUAL. https://www.mql5.com/en/users/tec_daniel SOME EXAMPLES OF SIGNALS ON “mql5.com” BEING TR

The XG Gold Robot MT4 is specially designed for Gold. We decided to include this EA in our offering after extensive testing . XG Gold Robot and works perfectly with the XAUUSD, GOLD, XAUEUR pairs. XG Gold Robot has been created for all traders who like to Trade in Gold and includes additional a function that displays weekly Gold levels with the minimum and maximum displayed in the panel as well as on the chart, which will help you in manual trading. It’s a strategy based on Price

We proudly present our cutting-edge robot, the Big Forex Players EA designed to maximize your trading potential, minimize emotional trading, and make smarter decisions powered by cutting-edge technology. The whole system in this EA took us many months to build, and then we spent a lot of time testing it. This unique EA includes three distinct strategies that can be used independently or in together. The robot receives the positions of the biggest Banks (p ositions are sent from our databa

Golden Trend indicator is The best indicator for predicting trend movement this indicator never lags and never repaints and never back paints and give arrow buy and sell before the candle appear and it will help you and will make your trading decisions clearer its work on all currencies and gold and crypto and all time frame This unique indicator uses very secret algorithms to catch the trends, so you can trade using this indicator and see the trend clear on charts manual guide and

人工知能システムは、フラクタル、出来高、価格変動などのさまざまな指標を分析し、ポジションのエントリーを決定します。グリッドとマーチンゲールは使用しません。 10年以上の歴史でテストに成功しています Scalper AI は、市場の重要なポイントに未決注文を発注するために 2 つの戦略を使用します。 1 番目の戦略は 2 つの異なる時間枠の特定のフラクタルを使用し、2 番目の戦略は出来高に基づいて価格行動を分析し、安値と高値の保留を設定します。 ストップロスは各取引で使用されます。トレーリングストップは取引からより多くの利益を得ようとします。 ゴールドの取引のみに推奨され、最適なタイムフレームは m30 ですが、m15 および H1 でも使用できます。 リアルタイムの結果はここで確認できます。 個人ボーナスを獲得するには、購入後すぐにご連絡ください。 設定・マニュアルはこちら 設定 Start Trail - EA は X ピップス後に利益の追跡を開始します。 Trail - EA は X ピップスを追跡します。 Increase 0.01 lot each X profit - E

After your purchase, feel free to contact me for more details on how to receive a bonus indicator called VFI, which pairs perfectly with Easy Breakout for enhanced confluence!
Easy Breakout is a powerful price action trading system built on one of the most popular and widely trusted strategies among traders: the Breakout strategy ! This indicator delivers crystal-clear Buy and Sell signals based on breakouts from key support and resistance zones. Unlike typical breakout indicators, it levera

ゴールドドラゴンなしグリッド! マーチンゲールはダメだ! ダフ屋ではありません! Itトレンドexpert advisor。
Gold Dragonは、特定の市場パターンを活用し、ブレイクアウトの前に形成される市場統合の期間を特定する戦略を使用しています。 EAは、これらの統合レベルの上下に保留中の注文を配置し、これらの吹き出物の間に重要な価格の動きをキャプチャするのに非常に効果的です。 EAは、複数の注文を配置することができますが、マーチンゲールシステムではなく、利益を最大化し、まだあなたのアカウントを保護するために、動的なSL
私はeaやセットをtelegram it詐欺で販売しないように注意してください。 すべての設定はここでブログで無料です。 重要! 指示とボーナスを得るために購入後すぐに私に連絡してください!
私の他のプロダクトと同様、実質操作の監視はここに見つけることができます: https://www.mql5.com/en/users/mechanic/seller  ;
入力値
*新しいシリーズを開く–True/False–EAは別の

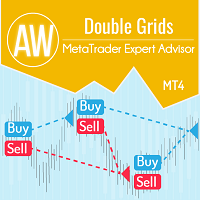
AWダブルグリッドMT4エキスパートアドバイザーは、情報取引パネルと簡単なセットアップを備えた、積極的で完全に自動化されたグリッドベースのエキスパートアドバイザーです。戦略は、一方向のボリュームを乗算する、同時の両面作業で構成されます。ロットの組み込み自動計算、および注文の乗算のバリエーション。 Problem solving -> HERE / MT5 version -> HERE アドバイザーの取引方法: EAは2つの反対の注文を開くことによって取引を開始します。収益性の高い注文をクローズした後、EAは再び2つの注文をオープンし、オープン方向のボリュームを乗算します。未決済の注文がある場合、EAはTakeProfitをポイントで変更します。 TakeProfitは動的であり、反対方向の未決済注文の数に応じて調整されます
注文のグリッドをさらに開くには、現在の方向の未決済注文の数に応じて変化する動的なステップもあります 入力パラメータ: Main settings Size of the first order - Variable defining the size

Recovery Manager Pro は、他のアドバイザーまたは手動でオープンされた注文からのドローダウンを回復するためのシステムです。 RM Pro には、自動的に動的に調整する機能があります。トレーダーはリスクレベルを選択する必要があり、アドバイザーは完全自動モードで動作します。 ドローダウンリカバリモードとスタンバイモードで動作可能!別のアドバイザーがドローダウンを生成した場合、RM Proはそれを無効にし、ポジションをロックし、部分クロージャを使用してデポジットを復元するプロセスを開始します。取引では、アドバイザーはスマートな平均化、ロック、部分クロージングを使用します。アドバイザーはカスタム トレンド インジケーターに取り組んでおり、アドバイザーのすべての購入者がギフトとして受け取ります。 Advisor の主な機能は、スタンバイ モードで動作できることです。別のアドバイザーがドローダウンを生成するとすぐに、RM Pro が注文管理を引き継ぎ、平均注文をオープンし、その後部分的にクローズします。 セットアップ手順: リンク MT5のバージョン:

Quantum strategy is a combination of quantum superposition and trading signal model. EA Quantum Dark Gold determines Buy and Sell positions simultaneously for each signal and simultaneously places 2 orders Buy Stop and Sell Stop. Then the momentum determines which order position is executed and cancels the remaining pending order. This interesting idea forms the Quantum Dark Gold with a unique entry method. Open positions are then managed by Trailing, Stop Loss and position balancing strategies

Scalper Vault は、スキャルピングを成功させるために必要なすべてを提供するプロフェッショナルなスキャルピング システムです。このインジケーターは、外国為替およびバイナリー オプションのトレーダーが使用できる完全な取引システムです。推奨される時間枠は M5 です。 システムは、トレンドの方向に正確な矢印シグナルを提供します。また、トップとボトムのシグナルとギャン マーケット レベルも提供します。 インジケーターは、プッシュ通知を含むすべてのタイプのアラートを提供します。 インジケータの購入後にご連絡ください。私の個人的な取引の推奨事項と素晴らしいボーナス指標を無料で共有します! 幸せで有益な取引をお祈りします!

Kamikaze Trading is the latest generation of automated trading robots for the Forex and Gold markets. The EA is programmed with premium algorithms and unique trading strategies that deliver stable performance and low risk. The strategy analyzes price action and price tick patterns, combines scalpers and smart position management and has available risk management options such as Max Stop Loss, Close all at Friday, Trailing, in which Max Stop Loss is often large so that the price has space to mov

LENA Scalp MetaTrader 5 バージョン:近日公開予定
高度なストップロステクノロジーと人工知能を活用したLena Expert Advisorは、革新的なトレーディング体験を提供します。 Lenaのロボットは、大きなストップロス、マーチンゲール、またはグリッドトレーディングを使用しません。代わりに、市場の状況に適応する動的なストップロスシステムを採用しています。 人工知能による分析は、戦略に基づいた市場の重要な機会を特定するのに役立ちます。 この自動化されたトレーディングソリューションは、経験豊富なトレーダーによって設計された堅実で実証済みのアプローチに基づいており、信頼性と効率性を提供します。
大きな損失制限は使用せず、アクティブ化が無効であることを検出すると、可能な限り最小限の損失で終了し、ライブ口座での取引 (これは人工知能の検出です) を終了します。 完全版を購入すると、 Super Lena-Hijack の無料コピーが送られます。 Lena Scalp シグナルライブ版 = https://www.mql5.com/en/sign

Introducing Gold Mint Scalper EA dedicated to Gold market (XAUUSD) with latest auto trading algorithms. The system combines cube momentum models with volatility to find the best trading signals. The cube momentum algorithm multiplies the fluctuations and quantifies high probability signal patterns. More signals, more trading opportunities. Along with Scalper method with Trailing, Stop Loss is set up in setting panel. EA is simple to install and use with only default settings (for Gold there are

MetaTrader4のコピー機を取引します。 それは任意の口座からの外国為替取引、ポジション、注文をコピーします。 それは最高の貿易コピー機の1つです MT4 - MT4、MT5 - MT4 のために COPYLOT MT4 バージョン(または MT4 - MT5 MT5 - MT5 のために COPYLOT MT5 バージョン)。 MT5のバージョン
完全な説明 +DEMO +PDF 購入する方法
インストールする方法
ログファイルの取得方法 テストと最適化の方法 Expforex のすべての製品 のコピー機 バージョン MetaTrader 5 ターミナル( МТ5 - МТ5、МТ4 - МТ5 )- コピーロットクライアントMT5 独自のコピーアルゴリズムにより、すべての取引がマスターアカウントからクライアントアカウントに正確にコピーされます。
また、動作速度が速いことでも知られています。タフなエラー処理。
強力な機能セット。
プログラムは、複数

FX Volume:ブローカー視点で捉える本物の市場センチメント クイック概要
トレード手法をさらに高めたいとお考えですか? FX Volume は、リテールトレーダーやブローカーのポジション状況をリアルタイムで提供します。これは、COTのような遅延レポートよりもはるかに早く知ることができます。安定した利益を目指す方も、さらなる優位性を求める方も、 FX Volume は大きな不均衡を見極め、ブレイクアウトを確認し、リスク管理を洗練させるのに役立ちます。今すぐ始めて、実際の出来高データがどのように意思決定を変革するかを体感してください!
1. FX Volume がトレーダーにとって非常に有益な理由 高精度の早期警戒シグナル
• 各通貨ペアを売買しているトレーダー数を、他者よりも早く、ほぼリアルタイムで把握できます。
• FX Volume は、複数のリテールブローカーから得られる本物の出来高データを収集し、分かりやすい形式で提供する 唯一 のツールです。 強力なリスク管理
• ロングやショートの大きな偏り(インバランス)を特定し、潜在的なトレンド転換を見逃しません。ストップ