• 概要
  • レビュー
  • コメント

Trend TD

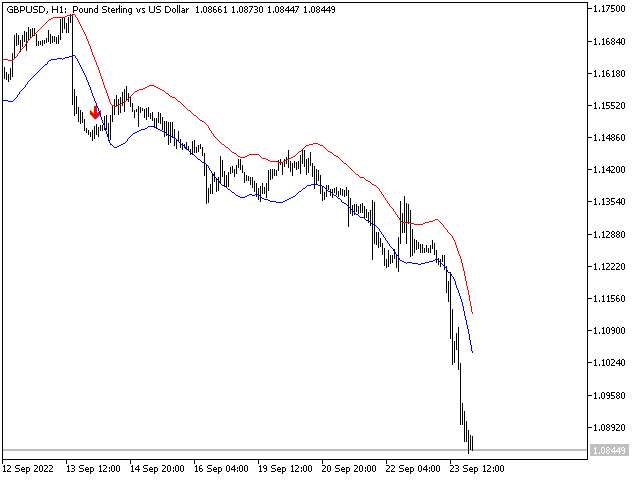
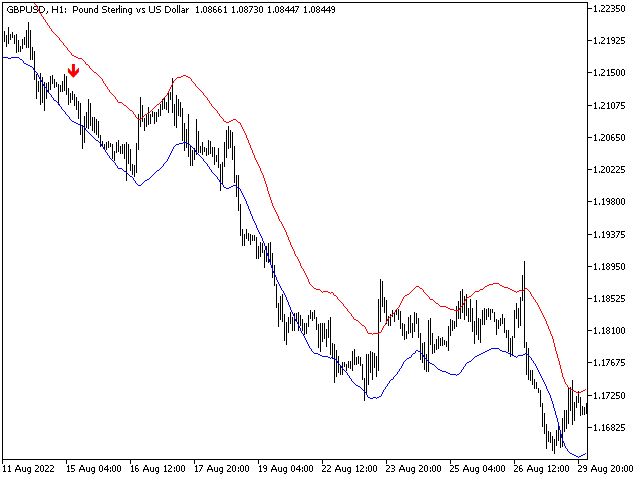
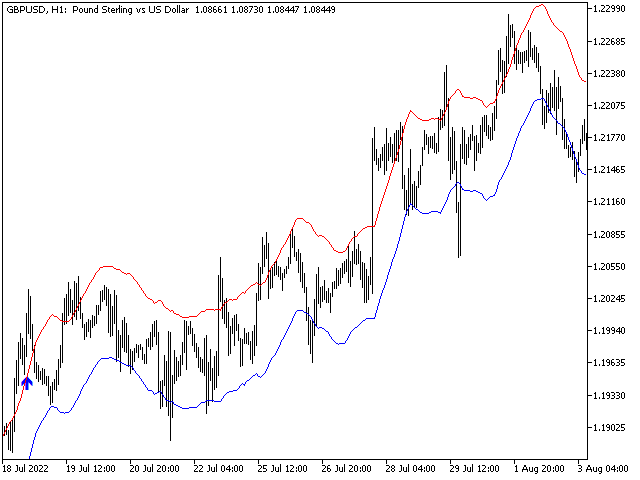
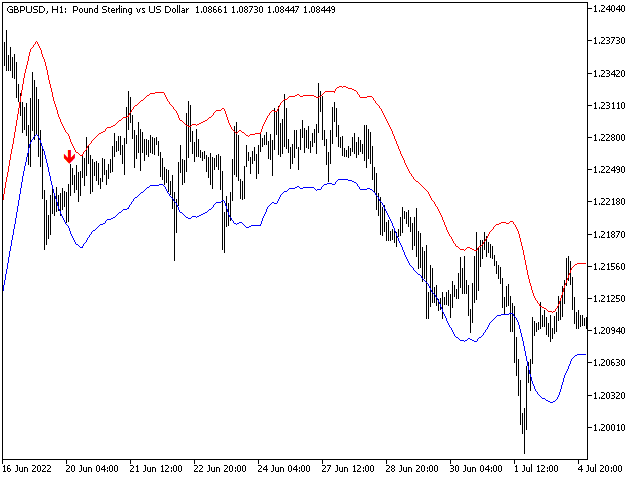
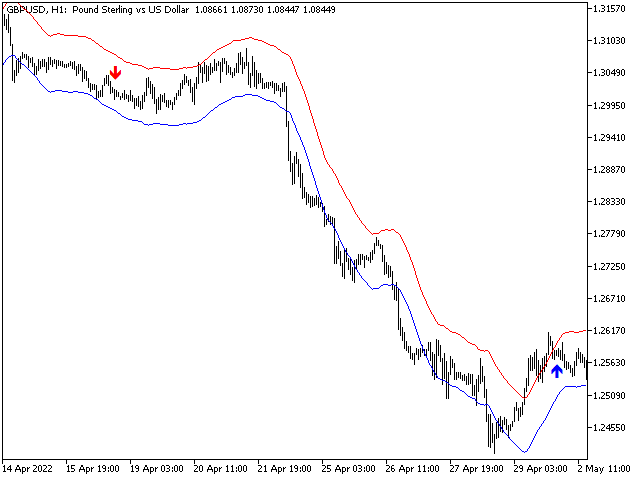
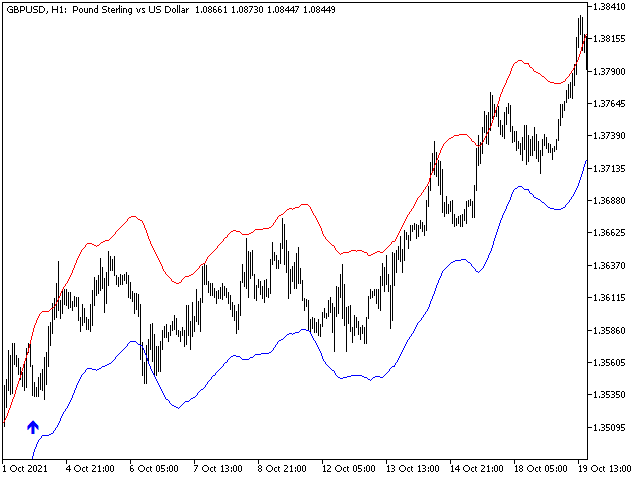
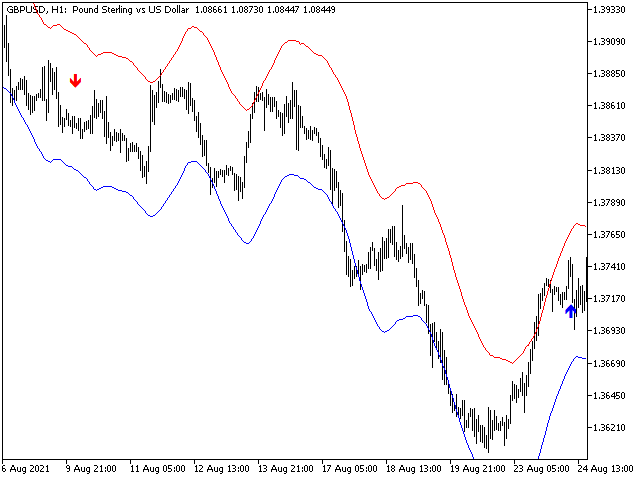
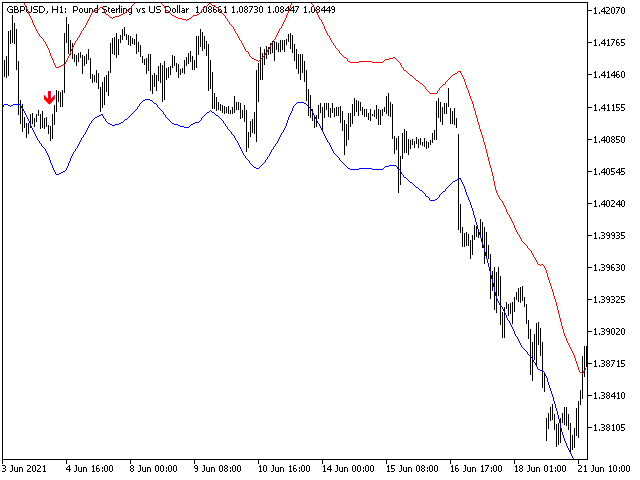
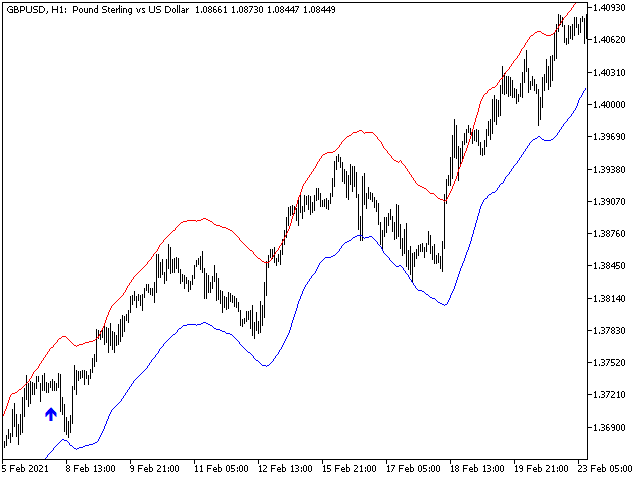
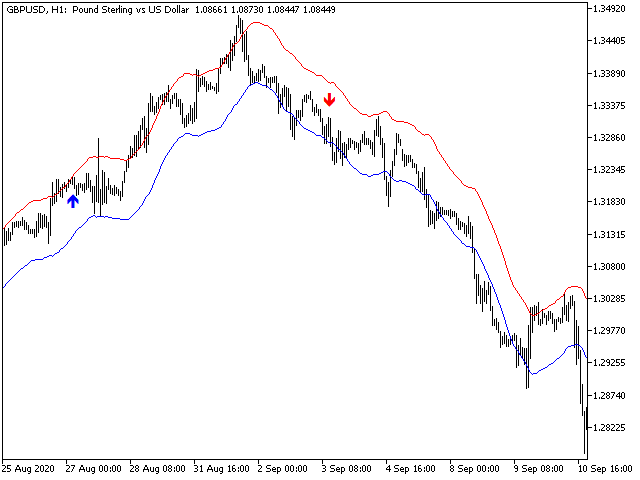
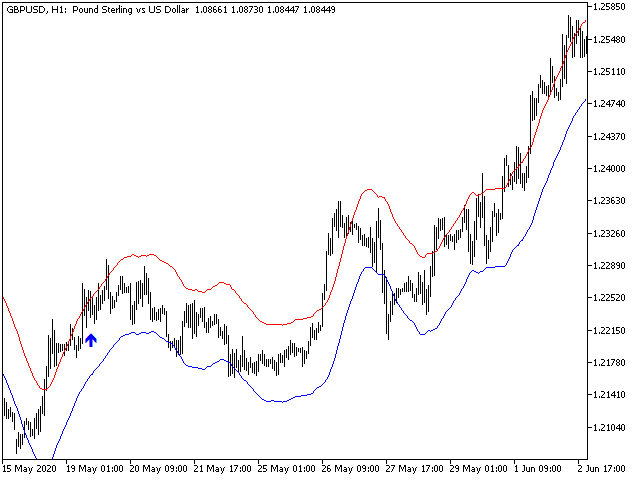
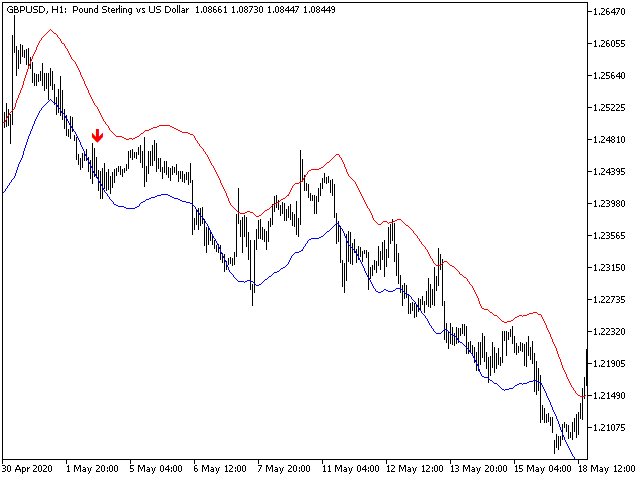
Trend  TD is a trend indicator. Thanks to the algorithm of this indicator, the signal will never go against the trend. Thanks to the two lines forming a narrow channel, the algorithm for analyzing entry points, the algorithm controls the reversal moments at the moment when the upper line of the channel has reversed and it is possible to visually draw a line crossing the upper line with itself in the past, while crossing the lower line at one point. If this rule is fixed, then the signal will be clearly indicated on the chart. In order for the algorithm to capture this signal, there are parameters that allow you to adjust the moment of signal registration.
  • Length - the number of bars for calculating the corridor.
  • Shift – offset from the zero bar.
  • Method - method of drawing lines.
  • AppiedPrice - the price against which the calculation is being made.
  • Deviation - channel width.
  • CamelsHump - The length of the search vector for the second intersection point.
  • PointNeighborhood - the number of points to expand the search point.
  • WorkOnTrend - work with a trend or a channel.


おすすめのプロダクト
The indicator detects and displays М. Gartley's Butterfly pattern. The pattern is plotted by the extreme values of the ZigZag indicator (included in the resources, no need to install). After detecting the pattern, the indicator notifies of that by the pop-up window, a mobile notification and an email. The pattern and wave parameters are displayed on the screenshots. The default parameters are used for demonstration purposes only in order to increase the amount of detected patterns. Parameters
MT4版  |  FAQ Owl Smart Levels Indicator は、 Bill Williams の高度なフラクタル、市場の正しい波構造を構築する Valable ZigZag、エントリの正確なレベルをマークする Fibonacci レベルなどの一般的な市場分析ツールを含む 1 つのインジケーター内の完全な取引システムです。 利益を得るために市場と場所に。 戦略の詳細な説明 インジケータを操作するための指示 顧問-取引助手 プライベートユーザーチャット ->購入後に私に書いて、私はプライベートチャットにあなたを追加し、あなたはそこにすべてのボーナスをダウンロードすることができます 力はシンプルさにあります! Owl Smart Levels 取引システムは非常に使いやすいので、専門家にも、市場を勉強し始めて自分で取引戦略を選択し始めたばかりの人にも適しています。 戦略と指標に秘密の数式や計算方法が隠されているわけではなく、すべての戦略指標は公開されています。 Owl Smart Levels を使用すると、取引を開始するためのシグナルをすばやく確認し、注文を出すため
The Expert Advisor and the video are attached in the Discussion tab . The robot applies only one order and strictly follows the signals to evaluate the indicator efficiency. Pan PrizMA CD Phase is an option based on the Pan PrizMA indicator. Details (in Russian). Averaging by a quadric-quartic polynomial increases the smoothness of lines, adds momentum and rhythm. Extrapolation by the sinusoid function near a constant allows adjusting the delay or lead of signals. The value of the phase - wave s
The standard Bollinger Bands indicator has been improved by integrating additional indications from the Standard Deviation indicator (StdDev), which gives an additional filter for confirming trading signals. In addition, the color of the indicator's lines shows the beginning of a trend, its development and exhaustion. This indicator has a signal block that notifies the trader of the beginning of the trend on any time frame to which it is attached. Settings Type of messages - select the type of
まず第一に、この取引インジケーターは再描画されず、再描画されず、遅延しないことを強調する価値があります。これにより、手動取引とロボット取引の両方に理想的なものになります。 ユーザーマニュアル:設定、入力、戦略。 アトミックアナリストは、価格の強さとモメンタムを利用して市場でより良いエッジを見つけるためのPA価格アクションインジケーターです。ノイズや誤ったシグナルを除去し、取引ポテンシャルを高めるための高度なフィルターを備えています。複雑なインジケーターの複数のレイヤーを使用して、アトミックアナリストはチャートをスキャンし、複雑な数学的計算をシンプルなシグナルと色に変換します。これにより、どのような初心者トレーダーでも理解して使用し、一貫した取引の決定を行うことができます。 「アトミックアナリスト」は、新規および経験豊富なトレーダー向けにカスタマイズされた包括的な取引ソリューションです。プレミアムインジケーターとトップノッチの機能を1つの取引戦略に組み合わせ、すべてのタイプのトレーダーにとって汎用性のある選択肢にします。 デイリートレーディングとスキャルピング戦略:高速で正確な
トレンドラインは、外国為替取引におけるテクニカル分析の最も重要なツールです。残念ながら、ほとんどのトレーダーはそれらを正しく描画していません。自動トレンドラインインジケーターは、市場のトレンドの動きを視覚化するのに役立つ本格的なトレーダー向けのプロフェッショナルツールです。 トレンドラインには、強気トレンドラインと弱気トレンドラインの2種類があります。 上昇トレンドでは、外国為替トレンドラインは価格変動の最低スイングポイントを介して描画されます。 少なくとも2つの「最低安値」を接続すると、トレンドラインが作成されます。 下降トレンドでは、トレンドラインは価格変動の最も高いスイングポイントを介して描画されます。 少なくとも2つの「最高値」を接続すると、トレンドラインが作成されます。 トレンドラインが壊れたとき? 弱気のろうそくが強気のトレンドラインの下で閉じ、ろうそくの高さがトレンドラインの上にあるとき、強気のトレンドラインは壊れます。 強気のろうそくが弱気のトレンドラインの上で閉じ、ろうそくの安値がトレンドラインの下にあるとき、弱気のトレ
プレミアムレベルは、正しい予測の精度が80%を超える独自の指標です。 この指標は、最高のトレーディングスペシャリストによって2か月以上テストされています。 あなたが他のどこにも見つけられない作者の指標! スクリーンショットから、このツールの正確さを自分で確認できます。 1は、1キャンドルの有効期限を持つバイナリーオプションの取引に最適です。 2はすべての通貨ペア、株式、商品、暗号通貨で機能します 手順: 赤い矢印が表示されたらすぐにダウントレードを開き、青い矢印が表示されたら閉じます。青い矢印の後に開くこともできます。 試してテストしてください!推奨設定はデフォルトです! 日足チャートで最高の精度を示します! インディケータは、2600 Pipsの収益性に対して、約10Pipsという非常に小さなマージンを使用します。
This Indicator draws Fibonacci Fan levels in two different ways. You can select whether to draw Fibonacci Fan levels based on your favourite ZigZag settings or you can let the indicator to draw Fan levels based on given number of bars or candles.  You can also set Mobile and Email notification for your favourite Fan  levels individually. With this indicator you will not have to feel lonely as the it can generate Voice alerts, which will keep you focused on your trading and remove boredom.  Prod
The indicator detects divergence signals - the divergences between the price peaks and the MACD oscillator values. The signals are displayed as arrows in the additional window and are maintained by the messages in a pop-up window, e-mails and push-notifications. The conditions which formed the signal are displayed by lines on the chart and in the indicator window. The indicator parameters MacdFast - fast MACD line period MacdSlow - slow MACD line period MacdSignal - MACD signal line period Mac
ATrend
Zaha Feiz
4.67 (3)
ATrend: その仕組みと使い方 仕組み MT5プラットフォーム向けの「ATREND」インジケーターは、テクニカル分析手法の組み合わせを利用して、トレーダーに堅牢な買いと売りのシグナルを提供するように設計されています。このインジケーターは主に、ボラティリティ測定のために平均真の範囲(ATR)を活用し、潜在的な市場動向を特定するためのトレンド検出アルゴリズムを併用しています。 購入後にメッセージを残すと、特別なボーナスギフトが贈呈されます。 30ドルの価格で残り8部 主な特徴: - ダイナミックなトレンド検出: インジケーターは市場トレンドを評価し、シグナルを適宜調整することで、トレーダーが優位な市場環境に合わせて戦略を立てるのを支援します。     - ボラティリティ測定: ATRを使用することで、インジケーターは最適なストップロス(SL)とテイクプロフィット(TP)レベルを決定するために不可欠な市場ボラティリティを測定します。 - シグナルの視覚化: インジケーターは、チャート上に買いと売りのシグナルを視覚的に表示することで、トレーダーの意思決定を強化します。 操作手順 入力
Terra Infinity is a flat indicator. This improved version of the CalcFlat indicator has three additional lines that significantly increase its effectiveness. Unlike its predecessor with two static levels, Terra Infinity adds three dynamic lines above the main histogram, which are interpreted as follows: base signal line, minimum signal line, maximum signal line. These lines are formed using the additional parameter Avg, which is the average value of the histogram. Averaging produces a line
All about time and price by ICT. This indicator provides a comprehensive view of ICT killzones, Silver Bullet times, and ICT Macros, enhancing your trading experience.  In those time windows price either seeks liquidity or imbalances and you often find the most energetic price moves and turning points. Features: Automatic Adaptation: The ICT killzones intelligently adapt to the specific chart you are using. For Forex charts, it follows the ICT Forex times: In EST timezone: Session: Asia: 20h00-0
このインジケーターは、H.M.Gartley (「株式市場の利益」、1935 年) の開発に従って調和パターン (XABCD) を識別します。 D 点を透視投影の点として投影します (設定で ProjectionD_Mode = true を指定します)。 再描画はしません。 作業時間枠のバーが閉じるとき、特定されたパターン ポイントが Patterns_Fractal_Bars バーの間に移動していない場合、チャート上に (予想される価格変動の方向に) 矢印が表示されます。 この瞬間から、矢印はチャート上に永久に残ります。 連続した 2 ~ 3 つ以上の矢印 - これは市場状況の変化であり、再描画/再描画ではありません (時間枠を前後に切り替えてはなりません)。 注: 2 ~ 3 つ以上の矢印が連続している場合 - これは市況の変化であり、再描画ではありません。 パターンの総数は 85 です (Gartley-222 と Gartley-222WS を含む。完全なリストはコメント セクションにあります)。 識別されたすべてのパターンのうち、最後に識別されたパター
Unlike any indicator you’ve seen, Trend Volley is an advanced purpose-built trend trading charting system that has been successfully used in nearly every tradable market. It is unique in many ways. Trend Volley’s internal trend detector algorithm studies the market and dynamically chooses the right values for the internal parameters, to adapt to the price and to decrease consecutive trend failures. It can be applied to any financial assets:  forex, cryptocurrencies, metals, stocks, indices.  ITS
The indicator displays the delta and the cumulative delta based on the "Time & Sales" deals list data. In addition to the standard timeframes, the indicator displays data regarding the seconds timeframes (S5, S10, S15, S20, S30) to choose from. Using the rectangle, user can select an arbitrary area in the indicator subwindow to view the ratio of the volumes of deals of buyers and sellers within this area. Indicator features: The indicator works correctly only on those trading symbols for whi
Wolfe Wavesは、すべての金融市場に存在する自然に発生する取引パターンであり、均衡価格への戦いを表しています。これらのパターンは、短期および長期の時間枠で発生する可能性があり、現在の最も信頼性の高い予測反転パターンの1つであり、通常は強い長期の価格変動に先行します。 [ インストールガイド | 更新ガイド | トラブルシューティング | よくある質問 | すべての製品 ] クリアな取引シグナル 驚くほど簡単に取引できます カスタマイズ可能な色とサイズ パフォーマンス統計を実装します 適切なストップロスおよび利益レベルを表示します 電子メール/音声/視覚アラートを実装します インジケーターはパターンとブレイクアウト矢印を同時に描画し、インジケーターが展開するときにパターンが再描画されないようにします。ただし、エントリのブレイクアウトが何度も発生し、インジケータが再描画される場合、あまり頻繁にではなく控えめに再描画される可能性があります。インジケータは非バックペインティングです。 オオカミの定義 ウルフ波には、次の特性が必要です。 ( 例を見るにはここをクリック ) ウ
Description : Rainbow EA MT5 is a simple Expert advisor based on   Rainbow MT5 indicator witch is based on Moving average with period 34. The indicator is incorporated in the EA, therefore, it is not required for the EA to operate, but if you wish, you can download it from   my product page . The Expert Advisor settings are as follows : Suitable for Timeframes up to H1 The parameters below can be set according to your trading rules. StopLoss ( Stop Loss in pips) TakeProfit ( Take Profit in pi
Trend Monitor MT5
Pavel Zamoshnikov
4.5 (2)
The indicator generates early signals basing on ADX reading data combined with elements of price patterns. Works on all symbols and timeframes. The indicator does not redraw its signals. You see the same things on history and in real time. For better visual perception signals are displayed as arrows (in order not to overload the chart). Features The best results are obtained when the indicator works on two timeframes. For example: M30 – the indicator shows the main trend; M5 – the indicator ge
Fit line supports to extrapolation next movement of market, support for buy/sell decision. Indicator using spline algorithm to extrapolation.  You can change number of spline with parameter "PointsNumber" and number of extrapolation point with "ExtrapolateBars". Eextrapolation points will be save into csv format, with prefix in parameter "PointsPrefix", and store in folder File of Data Folder.
Noize Absorption Index - is the manual trading system that measures the difference of pressure between bears forces and bulls forces. Green line - is a noize free index that showing curent situation. Zero value of index shows totally choppy/flat market.Values above zero level shows how powerfull bullish wave is and values below zero measures bearish forces.Up arrow appears on bearish market when it's ready to reverse, dn arrow appears on weak bullish market, as a result of reverse expectation.
Special Channel channel indicator is a classic indicator of a family of channel indicators, the use of which allows the trader to respond in time to the price out of the channel set for it. This corridor is built on the basis of the analysis of several candles, starting from the last, as a result of which the extrema of the studied interval are determined. It is they who create the channel lines. Trading in the channel is one of the most popular Forex strategies; its simplicity allows even be
MetaCOT 2 is a set of indicators and specialized utilities for the analysis of the U.S. Commodity Futures Trading Commission reports. Thanks to the reports issued by the Commission, it is possible to analyze the size and direction of the positions of the major market participants, which brings the long-term price prediction accuracy to a new higher-quality level, inaccessible to most traders. These indicators, related to the fundamental analysis, can also be used as an effective long-term filter
This is an advanced multi-timeframe version of the popular Hull Moving Average (HMA) Features Two lines of the Hull indicator of different timeframes on the same chart. The HMA line of the higher timeframe defines the trend, and the HMA line of the current timeframe defines the short-term price movements. A graphical panel with HMA indicator data from all timeframes at the same time . If the HMA switched its direction on any timeframe, the panel displays a question or exclamation mark with a tex
Indicator and Expert Adviser  EA Available in the comments section of this product. Download with Indicator must have indicator installed for EA to work. Mt5 indicator alerts for bollinger band and envelope extremes occurring at the same time. Buy signal alerts occur when A bullish candle has formed below both the lower bollinger band and the lower envelope  Bar must open and close below both these indicators. Sell signal occur when A bear bar is formed above the upper bollinger band and upp
Supertrend indicator uses a combination of a moving average and average true range to detect the trend of a trading instrument. Supertrend indicator for MetaTrader 5 easily shows the trend as a line following the price. Triple SuperTrend Histo indicator  calculate  three supertrends to show the trend as a histogram. Changing the color from red to green means you can BUY , from green to red means you can SELL . Description of the method of drawing a histogram. The price is above the EMA 20
The Penta-O is a 6-point retracement harmonacci pattern which usually precedes big market movements. Penta-O patterns can expand and repaint quite a bit. To make things easier this indicator implements a twist: it waits for a donchian breakout in the right direction before signaling the trade. The end result is an otherwise repainting indicator with a very reliable trading signal. The donchian breakout period is entered as an input. [ Installation Guide | Update Guide | Troubleshooting | FAQ | A
Contact me  to send you instruction and add you in group. QM (Quasimodo) Pattern is based on Read The Market(RTM) concepts. The purpose of this model is to face the big players of the market (financial institutions and banks), As you know in financial markets, big traders try to fool small traders, but RTM prevent traders from getting trapped. This style is formed in terms of price candles and presented according to market supply and demand areas and no price oscillator is used in it. RTM con
Fractal 358 Plus is a predictive indicator that provides the clearest sight of price movements. Identifying graphic patterns such as Caixote (Crate), Pivot and Inside Candle , it shows entries and exits spots, as well as threats to your trades in the markets. It comes ready to use with B3 Mini Index (WIN$ series) and can be adjusted to use with any asset and timeframe. Fractal 358 unravels price movement Based on the Fibonacci sequence, Fractal 358 is a new and different way of reading and un
This is Gekko's Cutomized Relative Strength Index (RSI), a customized version of the famous RSI indicator. Use the regular RSI and take advantage two entry signals calculations and different ways of being alerted whenever there is potential entry or exit point. Inputs Period: Period for the RSI calculation; How will the indicator calculate entry (swing) signals: 1- Produces Exit Signals for Swings based on RSI entering and leaving Upper and Lower Levels Zones; 2- Produces Entry/Exit Signals fo
MonsterDash Harmonics Indicator is a harmonic pattern dashboard. It recognizes all major patterns. MonsterDash is a dashboard that displays all detected patterns for all symbols and (almost) all timeframes in sortable and scrollable format. Users can add their own user defined patterns . MonsterDash can open and update charts with the pattern found. Settings MonsterDash's default settings are good enough most of the time. Feel free to fine tune them to your needs. The color settings are for th
このプロダクトを購入した人は以下も購入しています
最初のパルスレベルを反転 (RFI)     指示する     ロシア     -        utilizar con   el indicador の ESP 推奨事項 -   TPSpro トレンド プロフェッショナル版 -   MT5のバージョン 最も重要なことは、将来においても最も重要なことです。 機能のプリンシパル: ゾーンのほとんどは、ベンダーとコンプラドールによってアクティブ化されます。 状況を直感的に把握できるよう、初期の衝動を修正します。 LOGIC AI: MUESTRA zonas (círculos) parabuscar puntos de entrada cuando se activa una plantilla 視覚的に優れた視覚効果があり、最も重要な機能がすべて揃っていることに注意してください。 優れたニベレス/ゾーンの視覚化 (modo MTF) 世界で最も人気のある場所/ゾーンです。これを使用するのに最適な方法です (   TPSproTREND PRO   )。 アルゴリズム プロフェッショナル セパラド パソ ア パソ パラ オペラ それは
TPSpro TREND PRO は 、市場を自動的に分析し、トレンドとその各変化に関する情報を提供し、再描画せずに取引にエントリーするためのシグナルを提供するトレンド指標です。 インジケーターは各ローソク足を使用し、個別に分析します。上向きまたは下向きのさまざまな衝撃を指します。通貨、仮想通貨、金属、株、指数の取引への正確なエントリーポイント! バージョンMT5                   インジケーターの完全な説明     RFI LEVELS インジケーター と併用することをお勧めします。 主な機能: レンダリングなしで正確な入力信号! シグナルが表示されると、それは関連性を維持します。これは、シグナルを提供してからそれを変更し、その結果、入金された資金が失われる可能性があるリドローインジケーターとの重要な違いです。より高い確率と精度で市場に参入できるようになりました。矢印が表示された後、ターゲットに到達する (利益確定) か反転シグナルが表示されるまで、ローソク足に色を付ける機能もあります。 STOP-LOSS/TAKE-PROFITゾーンの表示 エントリーポイン
まず第一に、このトレーディングシステムがノンリペイント、ノンリドロー、ノンラグのインジケーターであることを強調する価値がある。これにより、手動取引とロボット取引の両方に理想的なものになっています。 オンラインコース、マニュアル、プリセットのダウンロード。 「スマートトレンドトレーディングシステム MT5」は、新規および経験豊富なトレーダー向けにカスタマイズされた包括的なトレーディングソリューションです。10以上のプレミアムインジケーターを組み合わせ、7つ以上の堅実なトレーディング戦略を備えており、多様な市場状況に対応する多目的な選択肢となっています。 トレンドフォロー戦略:トレンドを効果的に乗り越えるための正確なエントリーとストップロス管理を提供します。 リバーサル戦略:潜在的なトレンドの反転を特定し、トレーダーがレンジ相場を活用できるようにします。 スキャルピング戦略:高速で正確なデイトレードおよび短期取引のために設計されています。 安定性:すべてのインジケーターはノンリペイント、ノンリドロー、ノンラグであり、信頼性の高いシグナルを保証します。 カスタマイズ:個々の取引の嗜好に合わせ
現在33%オフ 初心者にもエキスパートトレーダーにも最適なソリューション このインジケーターは独自の機能と新しい公式を多数内蔵しており、ユニークで高品質かつ手頃な取引ツールです。このアップデートでは、2つの時間枠ゾーンを表示できるようになります。より長いTFだけでなく、チャートTFとより長いTF(ネストゾーンを表示)の両方を表示できます。すべてのSupply Demandトレーダーの皆さんのお気に召すはずです。:) 重要情報の公開 Advanced Supply Demandの可能性を最大化するには、 https://www.mql5.com/ja/blogs/post/720245 にアクセスしてください。   エントリーまたはターゲットの正確なトリガーポイントを正確に特定できれば取引がどのように改善されるか想像してみてください。新しい基盤となるアルゴリズムに基づいて構築されているため、買い手と売り手の間の潜在的な不均衡をさらに簡単に特定できます。これは、最も強い需要と供給のゾーンと、過去のパフォーマンス(古いゾーンを表示)がグラフィカルに表現されるためです。これらの機能は、最適
MetaForecast M5
Vahidreza Heidar Gholami
5 (2)
MetaForecastは、価格データのハーモニクスに基づいて、どんな市場の未来を予測し視覚化します。市場が常に予測可能ではありませんが、価格にパターンがある場合、MetaForecastは可能な限り正確な未来を予測できます。他の類似製品と比較して、MetaForecastは市場のトレンドを分析することでより正確な結果を生成することができます。 入力パラメータ Past size (過去のサイズ) MetaForecastが将来の予測を生成するために使用するバーの数を指定します。モデルは選択したバー上に描かれた黄色の線で表されます。 Future size (将来のサイズ) 予測すべき将来のバーの数を指定します。予測された将来は、ピンクの線で表示され、その上に青い回帰線が描かれます。 Degree (程度) この入力は、MetaForecastが市場で行う分析のレベルを決定します。 Degree 説明  0 Degree 0の場合、価格の全てのピークや谷、そして詳細をカバーするために、「Past size」の入力に大きな値を使用することが推奨されています。  1 (推奨) Degr
FX Volume MT5
Daniel Stein
4.93 (14)
mql5と Telegramの モーニング・ブリーフィングで、詳細とスクリーンショットを含む毎日のマーケット・アップデートをご覧 ください! FX Volumeは、ブローカーの視点から市場のセンチメントをリアルに洞察する、最初で唯一の出来高インジケーターです。 ブローカーのような機関投資家が外国為替市場でどのようなポジションをとっているか、COTレポートよりもはるかに速く、素晴らしい洞察を提供します。 この情報をチャート上で直接見ることは、あなたの取引にとって真のゲームチェンジャーであり、画期的なソリューションです。 以下のようなユニークなマーケットデータ洞察から利益を得てください。 比率は 、通貨のロングポジションとショートポジションの比率をパーセントで表示します。 比率の変化は 、選択した期間内のロング比率とその変化率を表示します。 Volumes Totalは 、通貨の取引量(ロングとショート)の合計をロット単位で表示します。 Volumes Long :全通貨のロングポジションの取引量を表示します。 Volumes(ショート )は、全通貨のショートポジションの取引量を表示
Quantum Trend Sniper
Bogdan Ion Puscasu
4.79 (48)
ご紹介   クォンタム トレンド スナイパー インジケーターは 、トレンド反転を特定して取引する方法を変革する画期的な MQL5 インジケーターです。 13年以上の取引経験を持つ経験豊富なトレーダーのチームによって開発されました。     クォンタムトレンドスナイパーインジケーター   は、非常に高い精度でトレンドの反転を識別する革新的な方法で、あなたのトレーディングの旅を新たな高みに押し上げるように設計されています。 ***Quantum Trend Sniper Indicatorを購入すると、Quantum Breakout Indicatorを無料で入手できます!*** クォンタム ブレイクアウト インジケーターは、トレンドの反転を特定するとアラートを発し、矢印を示し、3 つのテイクプロフィットレベルを提案します。 初心者トレーダーにもプロのトレーダーにも適しています。 量子EAチャネル:       ここをクリック MT4のバージョン:       ここをクリック 推奨事項: 期間:すべての時間枠。最良の結果を得るには、M
発見が困難で頻度が少ないため、分岐は最も信頼できる取引シナリオの1つです。このインジケーターは、お気に入りのオシレーターを使用して、通常の隠れた分岐点を自動的に見つけてスキャンします。 [ インストールガイド | 更新ガイド | トラブルシューティング | よくある質問 | すべての製品 ] 取引が簡単 通常の隠れた発散を見つけます 多くのよく知られている発振器をサポート ブレイクアウトに基づいて取引シグナルを実装します 適切なストップロスおよび利益レベルを表示します 設定可能なオシレーターパラメーター カスタマイズ可能な色とサイズ バー単位でサイズ別に分岐をフィルタリング パフォーマンス統計を実装します 電子メール/音声/視覚アラートを実装します 幅広い市場の見通しを提供するために、異なるオシレーターを使用して、干渉なしで同じチャートにインジケーターを何度もロードできます。このインジケーターは、次のオシレーターをサポートしています。 RSI CCI MACD オスマ 確率的 勢い 素晴らしい発振器 加速器発振器 ウィリアムズパーセントレンジ 相対活力指数 特に外国為替市
今、147ドル(いくつかの更新後に499ドルに増加します) - 無制限のアカウント(PCSまたはMac) RelicusRoad ユーザー マニュアル + トレーニング ビデオ + プライベート Discord グループへのアクセス + VIP ステータス 市場の新しい見方 RelicusRoad は、外国為替、先物、暗号通貨、株式、および指数の世界で最も強力な取引インジケーターであり、トレーダーに収益を維持するために必要なすべての情報とツールを提供します。初心者から上級者まで、すべてのトレーダーが成功するためのテクニカル分析と取引計画を提供します。これは、将来の市場を予測するのに十分な情報を提供する重要な取引指標です。意味をなさないチャート上のいくつかの異なる指標ではなく、完全な解決策を信じています.これは、信号、矢印 + 価格アクション情報を表示するオールインワンのインジケーターで、他に類を見ない非常に正確です。 強力な AI に基づいて、RelicusRoad は不足している情報とツールを提供して、あなたを教育し、トレーディングのプロ、成功したトレーダーにします。
TPA True Price Action indicator reveals the true price action of the market makers through 100% non-repainting signals strictly at the close of a candle! TPA shows entries and re-entries, every time the bulls are definitely stronger than the bears and vice versa. Not to confuse with red/green candles. The shift of power gets confirmed at the earliest stage and is ONE exit strategy of several. There are available now two free parts of the TPA User Guide for our customers. The first "The Basics"
Step into the realm of Forex trading with confidence and precision using XQ, a cutting-edge Forex indicator designed to elevate your trading game to unprecedented heights. Whether you're a seasoned trader or just stepping into the world of currency exchange, XQ Forex Indicator empowers you with the insights and signals needed to make informed trading decisions. The signal conditions are a combination of three indicators, and XQ Forex Indicator only display  medium and long-term trends . The ind
SwingVolumePro
Thalles Nascimento De Carvalho
概要 SwingVolumePro は、幅広い金融資産に適用できる高度で多用途なインジケーターであり、さまざまな取引スタイルをサポートします。厳密なボリュームと価格の分析に基づいて開発されており、すべてのレベルのトレーダーが高品質のデータに基づいて情報に基づいた意思決定を行うための明確で正確なシグナルを提供します。 主な特徴 多用途性: SwingVolumePro は、株式、外為(フォレックス)、暗号通貨など、さまざまな資産に適用できます。スキャルピングから長期ポジションまで、さまざまな取引戦略に対応しています。 正確で信頼できるシグナル: 高精度なシグナルを提供することに重点を置いているSwingVolumeProは、価格吸収パターンや市場のアグレッションを特定するために高度な技術を使用しています。これらのシグナルは明確に表示され、迅速かつ効果的な意思決定が容易になります。 高度なボリュームと価格の分析: インジケーターは、ボリュームと価格の相互作用の詳細な分析を使用して、努力と結果の間にズレがある状況を検出し、市場の潜在的な動きを示唆します。
note: this indicator is for METATRADER4, if you want the version for METATRADER5 this is the link:  https://www.mql5.com/it/market/product/108106 TRENDMAESTRO ver 2.4 TRENDMAESTRO recognizes a new TREND in the bud, he never makes mistakes. The certainty of identifying a new TREND is priceless. DESCRIPTION TRENDMAESTRO identifies a new TREND in the bud, this indicator examines the volatility, volumes and momentum to identify the moment in which there is an explosion of one or more of these data a
Gartley Hunter Multi - An indicator for searching for harmonic patterns simultaneously on dozens of trading instruments and on all possible timeframes. Manual (Be sure to read before purchasing) | Version for MT4 Advantages 1. Patterns: Gartley, Butterfly, Shark, Crab. Bat, Alternate Bat, Deep Crab, Cypher 2. Simultaneous search for patterns on dozens of trading instruments and on all possible timeframes 3. Search for patterns of all possible sizes. From the smallest to the largest 4. A
このインディケータは、価格アクション分析とドンチャンチャネルのみを使用して、ジグザグ方式で価格の反転を検出します。再描画やバックペインティングを一切行わずに、短期取引向けに特別に設計されています。それは彼らの操作のタイミングを増やすことを目指している賢明なトレーダーにとって素晴らしいツールです。 [ インストールガイド | 更新ガイド | トラブルシューティング | よくある質問 | すべての製品 ] 驚くほど簡単に取引できます すべての時間枠で価値を提供します 自己分析統計を実装します 電子メール/音声/視覚アラートを実装します 可変長のブレイクアウトと混雑ゾーンに基づいて、インディケータは価格アクションのみを使用して取引を選択し、市場が非常に高速に行っていることに反応します。 過去のシグナルの潜在的な利益が表示されます この指標は、独自の品質とパフォーマンスを分析します 負けブレイクアウトは強調表示され、説明されます インジケータは、非バックペインティングおよび非再ペイントです この指標は、日中のトレーダーが単一の価格反転を見逃さないようにするのに役立ちます。ただし、す
Native Channels
BeeXXI Corporation
5 (1)
This indicator recognizes all support and resistance levels. A number of unique high-performance techniques have been applied, which made the existence of this indicator possible. All formed channels are naturally visible: horizontal linear linear parabolic cubic (Polynomial 3 degrees - Wave) This is due to a bundle of approximating channels. The formed channels form "standing waves" in a hierarchical sequence. Thus, all support and resistance levels are visible. All parameter management is
The Volumebyprice.com Indicator for MetaTrader 5 features Volume Profile and Market Profile TPO (Time Price Opportunity). Volume and TPO histogram bar and line charts. Volume Footprint charts. TPO letter and block marker collapsed and split structure charts. Static, dynamic and flexible range segmentation and compositing methods with relative and absolute visualizations. Session hours filtering and segment concatenation with Market Watch and custom user specifications. Graphical layering, posit
The AT Forex Indicator MT5 is a sophisticated trading tool designed to provide traders with a comprehensive analysis of multiple currency pairs. This powerful indicator simplifies the complex nature of the forex market, making it accessible for both novice and experienced traders. AT Forex Indicator uses advanced algorithms to detect trends, patterns and is an essential tool for traders aiming to enhance their forex trading performance. With its robust features, ease of use, and reliable signal
How to use Pair Trading Station Pair Trading Station is recommended for H1 time frame and you can use it for any currency pairs. To generate buy and sell signal, follow few steps below to apply Pair Trading Station to your MetaTrader terminal. When you load Pair Trading Station on your chart, Pair Trading station will assess available historical data in your MetaTrader platforms for each currency pair. On your chart, the amount of historical data available will be displayed for each currency pai
Bill Williams Advanced is designed for automatic chart analysis using Bill Williams' "Profitunity" system. The indicator analyzes four timeframes at once. Manual (Be sure to read before purchasing) Advantages 1. Automatically analyzes the chart using the "Profitunity" system of Bill Williams. The found signals are placed in a table in the corner of the screen. 2. Equipped with a trend filter based on the Alligator indicator. Most of the system signals are recommended to be used only accordi
トレンドに乗りましょう。はい、買いでも売りでも、15分枠でエントリーシグナルを待ち、30分枠でシグナルが現れたらシグナルを確認します(シグナルが現れるまでに1時間以上かかる場合もあります。戻ることができます) 15分足に戻り、30分足に戻り、メインシグナルが現れるまでこれを繰り返し、30分足にシグナルが出たら価格でエントリーし、描画ラインが変化した時点で利益確定となります。 、利益が確定したとき、または反対のシグナルが現れたとき これは非常にシンプルで、すべての主要通貨で機能します。  メタル、インジケーター、すべてのフレームですが、最も良い結果は 30 分フレームです。 ストップロスは常にローソク足の底値よりも下に設定し、資本管理を超えてはなりません 資本金の10%
収益性の高い取引機会を簡単に特定するのに役立つ強力な外国為替取引インジケーターをお探しですか?ビースト スーパー シグナル以外に探す必要はありません。 この使いやすいトレンドベースのインジケーターは、市場の状況を継続的に監視し、新しいトレンドを検索したり、既存のトレンドに飛びついたりします。ビースト スーパー シグナルは、すべての内部戦略が一致し、互いに 100% 合流したときに売買シグナルを発するため、追加の確認は不要です。シグナル矢印アラートを受け取ったら、単に売買します。 購入後、プライベート VIP グループに追加されるようにメッセージを送ってください! (完全な製品購入のみ)。 購入後、最新の最適化されたセット ファイルについてメッセージを送ってください。 MT4版は こちらから。 Beast Super Signal EA は こちらから 入手できます。 コメント セクションをチェックして、最新の結果を確認してください。 ビースト スーパー シグナルは、1:1、1:2、または 1:3 のリスクと報酬の比率に基づいて、エントリー価格、ストップ
Volatility Trend System - a trading system that gives signals for entries. The volatility system gives linear and point signals in the direction of the trend, as well as signals to exit it, without redrawing and delays. The trend indicator monitors the direction of the medium-term trend, shows the direction and its change. The signal indicator is based on changes in volatility and shows market entries. The indicator is equipped with several types of alerts. Can be applied to various trading in
ご紹介     Quantum Breakout PRO は 、ブレイクアウト ゾーンの取引方法を変革する画期的な MQL5 インジケーターです。 13年以上の取引経験を持つ経験豊富なトレーダーのチームによって開発されました。     クォンタム ブレイクアウト プロ   は、革新的でダイナミックなブレイクアウト ゾーン戦略により、あなたのトレーディングの旅を新たな高みに押し上げるように設計されています。 クォンタム ブレイクアウト インジケーターは、5 つの利益ターゲット ゾーンを備えたブレイクアウト ゾーン上のシグナル矢印と、ブレイクアウト ボックスに基づいたストップロスの提案を提供します。 初心者トレーダーにもプロのトレーダーにも適しています。 量子EAチャネル:       ここをクリック 重要!購入後、インストールマニュアルを受け取るためにプライベートメッセージを送ってください。 推奨事項: 時間枠: M15 通貨ペア: GBPJPY、EURJPY、USDJPY、NZDUSD、XAUUSD アカウントの種類: ECN、Raw、またはス
WHY IS OUR FXACCCURATE LS MT5 THE PROFITABLE ? PROTECT YOUR CAPITAL WITH RISK MANAGEMENT Gives entry, stop and target levels from time to time. It finds Trading opportunities by analyzing what the price is doing during established trends. POWERFUL INDICATOR FOR A RELIABLE STRATEGIES We have made these indicators with a lot of years of hard work. It is made at a very advanced level. Established trends provide dozens of trading opportunities, but most trend indicators completely ignore them!
まず最初に、このトレーディングシステムがリペイントされず、再描画されず、遅延しないことを強調する価値があります。これにより、プロのトレーディングに最適な状態になります。 オンラインコース、ユーザーマニュアル、デモ。 「スマートサポートアンドレジスタンストレーディングシステム」は、新規および経験豊富なトレーダー向けにカスタマイズされた高度なインジケーターです。この包括的なシステムは、7以上の戦略、10のインジケーター、およびデイトレード戦略、スイングトレード戦略、サポートおよびレジスタンス戦略、ローソク足パターン戦略、VWAP戦略、マルチタイムフレームトレンド戦略など、さまざまなトレーディングアプローチを組み合わせています。これは、矢印信号、エントリーポイント、出口ポイント、トレードアラート、より高い時間枠のトレンド分析、リアルタイムのトレードモニタリング、そして洞察力のあるトレンドとボリュームキャンドルの着色を提供します。自動的なサポートとレジスタンスの検出により、さまざまな市況下でトレーダーが的確な決定を下すのを支援する多面的なインジケーターとなっています。 スマートサポートア
Allows multiple indicators to be combined into a single indicator, both visually and in terms of an alert. Indicators can include standard indicators, e.g. RSI, CCI, etc., and also Custom Indicators, even those purchased through Market, or where just have the ex4 file. An early alert is provided, say when 4 out 5 indicators have lined up, and a confirmed alert when all are in agreement. A‌lso features a statistics panel reporting the success of the combined indicator by examining the current cha
Cryo
Sabina Fik
5 (1)
Cryo is based on the process of identifying the rate of change in price growth and allows you to find entry and exit points from the market. A fundamental technical indicator that allows you to assess the current market situation in order to enter the market of the selected currency pair in a trend and with minimal risk. The Cryo indicator was created on the basis of the original indicators for searching for extremes, the indicator is well suited for determining a reversal or a large sharp je
MT4 Version   Order Blocks ICT   Kill Zones   SMT Divergences ICT Breakers The ICT Breakers indicator is a powerful tool for traders looking to gain an edge in the market. This indicator is based on the order flow and volume analysis, which allows traders to see the buying and selling pressure behind the price action. This information can be extremely valuable in identifying key levels of support and resistance, as well as potential turning points in the market. Breaker blocks are areas where i
これはほぼ間違いなく、MetaTraderプラットフォームで見つけることができる最も完全な調和価格形成自動認識インジケーターです。 19種類のパターンを検出し、フィボナッチプロジェクションをあなたと同じように真剣に受け止め、潜在的逆転ゾーン(PRZ)を表示し、適切なストップロスとテイクプロフィットレベルを見つけます。 [ インストールガイド | 更新ガイド | トラブルシューティング | よくある質問 | すべての製品 ] 19の異なる調和価格形成を検出します プライマリ、派生および補完フィボナッチ投影(PRZ)をプロットします 過去の価格行動を評価し、過去のすべてのパターンを表示します この指標は、独自の品質とパフォーマンスを分析します 適切なストップロスとテイクプロフィットのレベルを表示します ブレイクアウトを使用して適切な取引を通知します すべてのパターン比をグラフにプロットします 電子メール/音声/視覚アラートを実装します スコット・M・カーニーの本に着想を得て、この指標は最も純粋で急を要するトレーダーのニーズを満たすように設計されています。ただし、トレードを
作者のその他のプロダクト
This is a professional trading robot, which implements the classical Ichimoku based trading strategy. A signal is formed when the Ichimoku trend changes. For this purpose we will analyze intersection of the Tenkan-sen and Kijun-sen lines. The signal to buy is generated when the Tenkan-sen line crosses the Kijun-sen bottom-up. The top-down crossing is the signal to sell. The EA correctly processes errors, and works reliably in the market. Can work with the initial deposit from $100! It is importa
Neural
Andriy Sydoruk
5 (1)
Neural is a professional Expert Advisor, which implements the strategy of trading using neural networks and genetic algorithms. Machine learning is widely used in various fields and is intended to replace the human brain for solving complex problems of classification and prediction. Training of a neural network is performed on a data sample (historical data). The neural network save the trouble of constantly changing the strategy, it is sufficient to simply retrain the system for the current mar
Fortune
Andriy Sydoruk
3 (2)
Advisor (Fortune): Your Reliable Tool for High-Frequency Forex Trading The Fortune advisor is designed to be used on any timeframe, any currency pair, and on any broker's server. Its unique trading system makes it a versatile tool for traders. For optimal performance, it is recommended to trade liquid forex pairs, maintain a low spread, and use a VPS. You can start with a $100 deposit and a lot size of 0.01. Key Features and Benefits High-Frequency Trading : Utilizes two trading options: with v
ForexTrendMT4 Indicator: A Reliable Tool for Market Tracking The ForexTrendMT4 indicator offers reliable market trend tracking, filtering out sudden fluctuations and market noise. This tool helps identify trends and signals favorable entry points into the market using arrows. It is suitable for both scalping on shorter timeframes and long-term trading strategies. Based on the principles of technical analysis, ForexTrendMT4 takes into account the cyclical nature of the market. Key Features and A
This is a professional Expert Advisor, which implements the strategy of trading using the Divergents and DivergentsPoint indicators, as wells as filters of the global trend on higher periods. Analyzing the indicators, the system enters the market with a limited martingale and the ability to open up to 8 orders in one direction. Each series of orders has mandatory TakeProfit and StopLoss levels. Also, a trailing stop based on the SAR indicator is activated for a series in breakeven. The robot aut
Indicator of divergences. It can help you identify the flat and trend areas. It can be applied as a trading filter. It has only one parameter - Period . The indicator does not show entry points, but only visualizes the information. Keep in mind that the approach to trading should be comprehensive, additional information is required for entering the market. Parameters Period - period of the indicator.
Trend indicator based on the price divergence. It can help you in finding the entry points during the analysis. It can be applied as a trading filter. It has two parameters: Period and Level . The Level parameter allows filtering out unnecessary signals. For example, the Level parameter can be set to 0.0001 for EURUSD. The indicator can work both as an entry point generator and as a filter. The indicator clearly visualizes the information. Keep in mind that the approach to trading should be comp
Carousel expert system compensates drawdowns. The main indicator is Divergents . The EA allows working in one direction (for example, sell order series), while another direction (for example, buy order series) is in drawdown (compensation mode). If series in both directions operate in normal mode, the system does not switch to compensation mode. If a drawdown is detected in one of the directions, the EA goes into the compensation mode and starts compensating the loss-making series by the profita
Versatile expert system follows the principle "stay in the market for as long as possible". The main indicators are Moving Average and Relative Strength Index. The EA supports working in two directions simultaneously both following a trend and against it depending on the settings. A limited number of orders LimitOrders is used for operation. The EA correctly handles errors and reliably works with a deposit 1000 USD and higher. M5 and higher timeframes are supported. The EA has very flexible sett
Экспертная система IdeaClassic создана для спокойной торговли на рынке. Основная ее задача - работа с одни ордером без увеличения лота с обязательными стопами, причем стоп-лосс и тейк-профит должны быть одного порядка. Также есть возможность использовать трейлинг-стоп. Для формирования входного сигнала используется индикатор IdeaTrend . Для анализа данного индикатора используется функция, которая может анализировать данные индикатора комплексно. Анализируется до десяти последних сигналов от инди
IdeaIlan
Andriy Sydoruk
5 (1)
IdeaIlan expert system applies IdeaTrend indicator. The EA applies the martingale principle. The EA allows trading in two directions simultaneously. It also has a full set of tools allowing the EA to follow a trend and add to a position if the trend moves in unfavorable direction. The EA correctly handles errors and reliably works with a deposit of 10 000 USD and higher. M5 and higher timeframes are supported. Stop levels and trailing stop are applied. Parameters Magic - magic number; Requotes
PowerFlash - Советник реализует известную торговую стратегию на основе сетки. Это автоматическая торговая система. Вся работа автоматизирована. Бот использует минимум настроек.  Бот работает следующим образом. Выставляется, одновременно, сетка отложенных ордеров в обе стороны от текущей цены на дистанции, указанной пользователем. Размер сетки регулируется от 1 до 100. После чего, куда бы ни пошел рынок, отложенные ордера будут переходить в рыночные. Если рыночные ордера зайдут в общий профит, то
A unique expert system that works as without optimization, with the same settings (although it can be optimized if desired, especially for some brokers). You can test as you like, all ticks, control points, opening prices. The figure has an example. The potential result when testing an average of 100-500% over 3 years. It is recommended to make a multi-currency, if you choose a balanced combination, you can get results up to 500-1000% per annum with potential testing. Verified by EURUSD. The bot
Prophet is a trend indicator. Shows the direction of turning points. Can be used with an optimal risk-to-profit ratio. The arrows indicate favorable moments and directions for entering the market. Uses one parameter for setting (adjust from 1 to 3). The probability of a successful trend is very high. In the course of work, the take-profit is much larger than the stop-loss! Works on all currency pairs and on all timeframes.
The Trendes indicator works on all currency pairs and on all timeframes. The arrows indicate favorable moments and directions for entering the market. The probability of a successful trend is very high. Trendes can be used for both small pits and long-term trading. The indicator determines the entry points according to the methods described in the book "How to play and win on the stock exchange". Options LengthA  - The number of bars for calculating the first function; LengthB - The number of
The indicator Martingal works on all currency pairs and on all timeframes. The arrows indicate the optimal input points for the future Martingale averaging, even with a zero exponent. The indicator shows the signal to close the series only if all the previous signals can be closed in the profit. After closing the series in profit, you must immediately open the order in the direction of the signal. Thus, the signal for closing is simultaneously the point of reverse opening to the other side of th
If you do not yet have your trading strategy, you can take advantage of our ready-made trading strategy, which is most effective! The trend indicator Spin is created on the basis of price divergence. Will help in finding the entry points for analysis. Can be used as a filter in the trade. Has one Length parameter. The indicator can work for both entry points and filters. The indicator reflects information in a visual form. Do not forget that the approach to trading should be comprehensive, to en
Intelligent algorithm indicator Variator with accuracy generates input signals and output levels. If the average price is blue, you should look for entry points to open long positions when the market is not overbought, and if the average price is red, you should look for entry points to open short positions when the market is not oversold. The rules can be summarized as follows. You should buy during an uptrend when the price reaches the average or oversold, and sell during a downtrend when the
This indicator shows not just a line of the price balance, but also forecasts it for the specified number of bars ahead. That is, the level of the probable balance of the price reflects on the chart in the future. The level of balancing is set by the Balance parameter, that is, it can be drawn at any level. Forecasting the future with the Shift parameter. The indicator reflects information in a visual form. Do not forget that the approach to trading should be comprehensive, to enter the market r
The algorithm of the Tic Tac Toe indicator differs from the usual indicators on the price charts in that it completely ignores the flow of time and reflects only changes in the price. Instead of displaying the time intervals on the X axis, and the price value on the Y axis, the Tic Tac Toe indicator displays price changes on both axes. The indicator displays in red if prices rise by a certain base value (TicTacToe) and blue if prices fall on the same value. If prices fell / rose by less than a c
Indicator FiboZag - transfer the indicator to the chart and the Fibonacci levels will be built automatically on the last ZigZag turn. The main advantage lies in the correct construction of Fibonacci levels and markup of price levels. Simple, visual and effective use. The indicator is not redrawn and does not lag. Works on all currency pairs and on all timeframes.
Realization of trend movement indication with points for potential stops in the TrendCloud indicator. It can be easily used as an independent trading system. You can interpret this: the location of the course above or below the shadows show the presence of a trend. The transition to the shadow warns of a possible reversal. Entering the price inside the shadow speaks in a flat motion. The indicator tracks the market trend with unsurpassed reliability, ignoring sharp market fluctuations and noises
The Doonchian channel consists of two channel displays. Channel lines are determined by a simple and reliable algorithm. The channel is preferably used for trading inside the channel. The indicator does not redraw and does not lag; simple algorithms are the basis of the work. It works on all currency pairs and on all timeframes. As always a warning, we must not forget that the approach must be comprehensive, the indicator signals require additional information to enter the market.
The VictoryCPM (Currency Power Meter) indicator will show the strength of currency pairs. The indicator is created for those traders who prefer to trade several currency pairs at once. This tool is able to display on the trading chart data on the current strength of various currencies. The foreign exchange market has a dynamic structure, which is why different currencies affect each other. For this reason, in order to identify the optimal point for creating an order, it is necessary to familiari
The  Progressive  Expert System works using sharp tick movements. Works with a deposit of $ 100! The classic method of trading scalping. It is also worth noting that with the allowable spread level, the bot goes through any historical period on any currency pair. There is no point in testing at opening prices, either checkpoints or all tics. It is possible to work on accounts with a floating spread, entry into the market will occur only when the spread is lower than the level specified in the se
Экспертная система Element33 работает, на любых типах счетов. Работает как в 4-х так и с 5-значными котировками. Спрэд и реквоты не критичны, подойдет любой брокер. Экспертная система разбивает историю на 4 квартала, для оптимизации рекомендовано три года на периоде H1 или H4. Оптимизацию можно проводить по ценах открытия, результаты мало отличаются от тестирования по реальным тикам, поскольку бот работает по ценам открытия. Оптимизировать достаточно один раз в месяц! Для получения более хороших
A trend indicator that shows the direction of pivot points. It can be used with an optimal risk to reward ratio. The probability of a success trend is very high. The indicator uses arrows to show favorable time to enter the market and market entry directions. Uses only one adjustable parameter (a value from 1 to 3). Take profit is much larger than stop loss! The indicator works on all currency pairs and time frames.
The  WiseBW  indicator simplifies decision making by recognizing turns using the built-in algorithm, and then confirms signals at support / resistance levels. Thus, the indicator tracks the market trend with unsurpassed reliability, ignoring sharp market fluctuations and noise around the average price. The indicator can be used both for pipsing at small periods, and for long-term trading. Options: updown  - offset pips for indentation of icons; back  - how many bars to take into account; CountBa
The indicator bounds the price according to a cyclic wave dependency using moving averages. Thus, all the crossing points, in which the movement is changed considering the indicator period, are the optimal ones. The crossing points can be used as the potential market reversal points. However, do not forget about the complex approach: the indicator signals require additional data to enter the market.
ComplexPulse - pulse indicator or signal. Sensitive and responsive to price movements. The indicator shows the interdependence of various currency pairs, namely: USD, EUR, GBP, CHF, JPY. Currencies are measured in relative units, so in each unit of time the sum of all currencies will be equal to zero. Hence, one of the main elements of cluster indicators is the zero line, or the balance line (zero line). If a currency is below the balance line, then it is said that the currency is oversold rel
フィルタ:
レビューなし
レビューに返信