SensorMap
- インディケータ
- Juergen Thielen
- バージョン: 3.7
- アップデート済み: 16 4月 2023
Concept
Market arranges in Time upcoming Phases according to the present Results of its Interest.
Directing Modulations are an Interaction of immanent Periods, which show in Reference
- to Time cyclic Activity and
- to Price leveling Activity.
SensorMap is a reflecting Volume Mask of this Concept of Time and Price and
- apportioning developed Price Movements in an equalized 100 % - Range: how far moved ?
- indicating their Status by marking special Events: when which Action ?
- setting the Situation in a functional Relation to the presented Support/ Resistance - Motive: miss/ hit/ pass ?
equalize and reflect
Choose of relative
- Price Ranges and Moves
- Triple Moving Average
and mirror them instantaneously against their Channelcenter by Button on the Volume Band.
Content
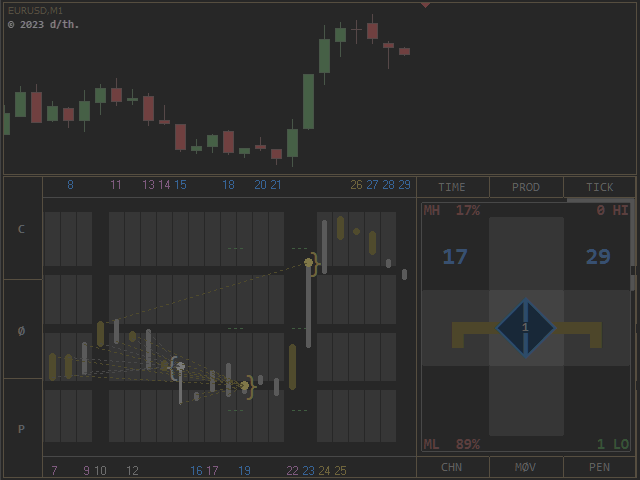
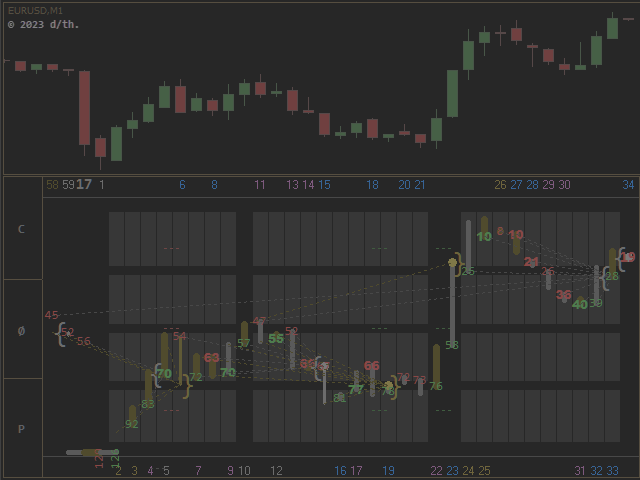
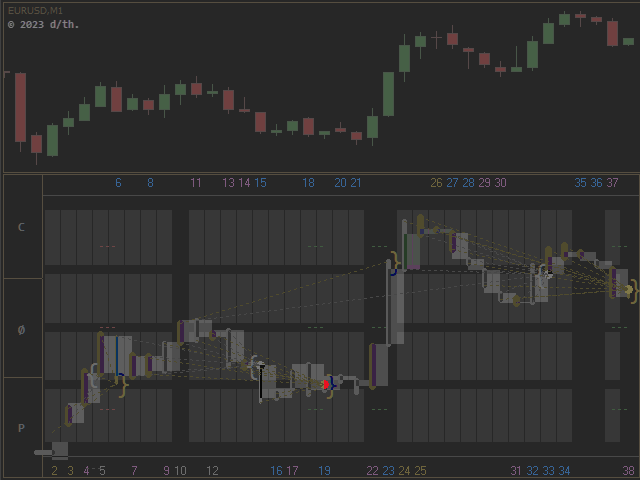
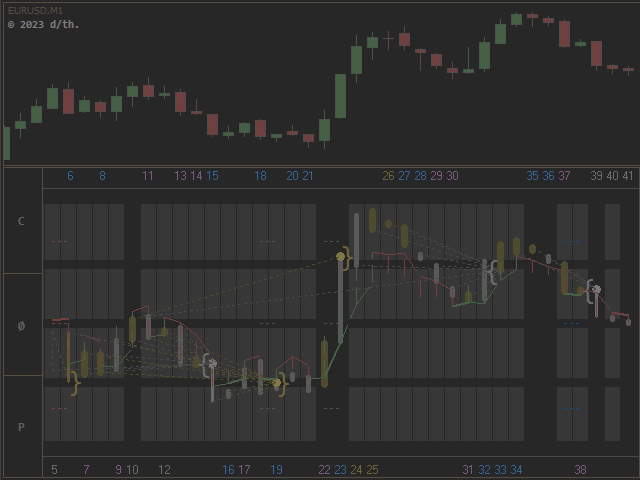
Price Time Channel
Multidimensional, equalized/ flattened and mirrorable Timingband as Matrix for Time, Price, Tick and Averages in definable Appearance Option.
Period Event Notation
Price is noted (in Relation to W1)
- as Bars, Clips [] and Streams (with Scales by ZeroLink),
- as Value (directional and white: Null/ Support, orange: Full/ Resistance),
- as Period Moves (Color set by the reached Level in Channel),
- as High- and Low-Range Trends (related to MN, Color directional).
Moving Averages
The Price Averages work as ranging Levels, each in its flattened Channel. They reflect the Movement as periodic Pricelines and cooperate.
Special Events are displayed:
- PointZero as situational Scale (15/ 50/ 85 %, blue: cyclic, green/ red: leveling)
- Close on limiting numeric Values (Fraction Hits bold),
- Tick Deviation to prior Period > +/-15 % (Background bright)
- interdimensional Crosses (Color Overtaking) and periodic Triggers (Line dotted) of Moving Averages
- Objects beyond their respective Channelband are lined up at Chartborder until Reentry (= Time is ticking for this Component)
Layers
- framing periodic Timedisplay (Side of Open/ if Zero at both Sides, Color: Channel Position)
- simplified Servertime Clock (Circulation = Period / 8) with relative Positions of Move-High and Move-Low on actual Period Range
- the conditional BullBear Compass indicates situational Phases with 3 Symbols and 4 Aggregate States
- on the Productivity-Cube
Additional Benefits
- individual Appearance Preferences
- a detailed Definition of Objects and Functions by the Descriptive Mode (Tool Tips)
- adjustable Window Size, seamless functional Complement for its origin opposite Pricechart
Contemplate its Concentrate
The Signal Density is related to Markets actual Phase, chosen Timeframe/ Security and Components.
SensorMap generates as resulting Composition a defined Setting of Support and Resistance:
No Matter which Hemisphere: [ Open = Support | Resistance = Close ]
Both look like the Other.
The MindMask resolves the active Status.
Indicative : Colorized : Universal
Please find all necessary Informations to this Product in its Compendium.
Below as Orientation the Extract of the individual Indicator-Adjustments.
Indicator SensorMap
Think global - Act local
Multidimensional, equalized and mirrorable VolumeBand
- as Matrix for Time, Price, Tick
- and Channel (Ranges/ Moves/ Averages)
- Window-Height = 135%
- Border-Clock-Frame = 115%
- Tick-Barsize = 100%
- colored ZeroPoint Scale = 15%/ 50%/ 85%
- black Bar-Divider = 25%/ 50%/ 75%
Buttons to the Left: Mirror-Function of Channel/ Average/ Pen.
Edging Values are lined up at Chartborder.
- 1D Time
- periodic Sentence
- equalized Product = Timeline
- 3D Productivity Sensor + 12D BullBear Compass
- Productivity = Potential
- -2 / -1 / 0 / +1 / +2
= Sensor = Sequence
- BullBear = Phase
- Rotor/Stator
- Trend/Trace
- Gator/Zero
= Compass = Sentence
[VALUE] =
- Boolean: Button Position on Chart
- Variable: default Value
The default View of the Chart consists of following Components and is read like follows:
Time Band
Moves (escalative Trace/Trend), by default depicted via ZeroLink-Module:
- Colors:
- Close = orange
- Open = brightgray
- as Pens (Bars)
- by Close and Open
- 2x2 overlaying Lineweights
- as Clips
- Perspective of Activa
- works as Pointer
- as Streams
- interactive OC-Work
- presents active Phase
- actual and last active Directive
- as big Dot
ZeroLink: Appearance of PointZero as periodic Scale (dotted)
- blue: active Time/ Cycle
- directional: active Price/ Level
Volume Clock
- Frame = Period Clock (Period / 8)
- Background = Productivity Potentiometer 3D
- Onlay Bull Bear Compass 12D
- Onlay Clock
- Position on active operative Mode-Side
- Coloring according Price Position in Channel
- valid also for TimeBand-Frame-Periods
| Shell % | Shell % | Tone |
| <0 - 15 | 85 - 100> | orange |
| 15 - 30 | 70 - 85 | blue |
| 30 - 45 | 55 - 70 | violet |
| 45 - 50 | 50 - 55 | gray |
(Potential-Shells of Unit 1 = Being develops from Within (2D-Center = 50% = 3D-Center = 0%))
Fundament
Body of Chart
Buttons of the Price-Chart, to have direct Access to its three Core-Options.
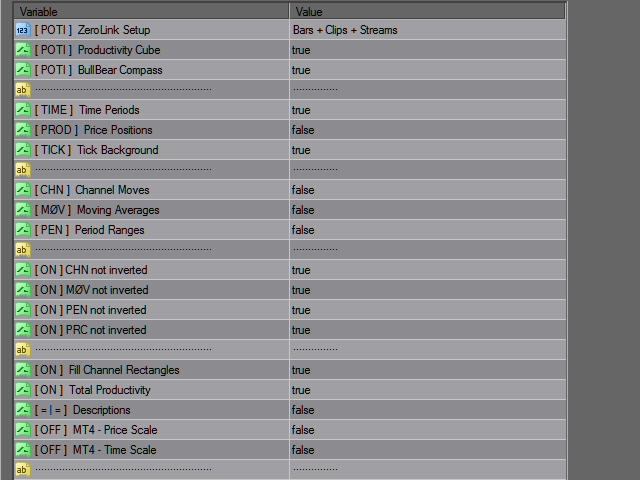
ZeroLink Setup [POTI]:
Toggle the Composition of the default Chart-Layout:
- in Options:
- choose of limitless Adjustability
- on Chart:
- toggle separate Components
- by Click on the Poti-Background
- first Click minus Clips
- second Click minus Streams
- third Click minus Pens
- fourth Click all back
Productivity Cube [POTI]:
Productivity Display -1 / 0 / +1
VPP = Volume per Period:
- 3 vertical Bars
- absolute (= Frequency)
- Impulse / Period
- Sensitivity 15%
- 3 horizontal Bars
- relative (= Alteration)
- Impulse / Pip
- Sensitivity 33%
PPT = Pips per Tick:
- 9 resulting Positions
- total (= Oscillation)
- Pip / Impulse
- Sensitivity 2 x 25 = 50%
| VPP [-15%] | VPP [= 0] | VPP [+15%] | ||
| TPP [+33%] | = 0 | + 1 | + 2 | PPT [+50%] |
| TPP [= 0] | - 1 | = 0 | + 1 | PPT [+25%] |
| TPP [-33%] | - 2 | - 1 | = 0 | PPT [= 0] |
| PPT [-50%] | PPT [-25%] | PPT [= 0] | ||
(ionic = Sensor of current electronic Potential)
BullBear Compass [POTI]:
Sensor of current sequential Phase
Arms: Color navigational/ positional
- Zero = gray
- Gator = orange
- else directional
Gate = Tap = Zero/ Gator
- Prop horizontal = Level Phase
- glides
- Prop vertical = Cycle Phase
- sways
Bull = Gap to North/ Lap to South
- Arms up = Rotor/ Level Trend
- hurls
- Arms right = Stator/ Cycle Trace
- looks like C, but is O
Bear = Gap to South/ Lap to North
- Arms down = Rotor/ Level Trace
- runs
- Arms left = Stator/ Cycle Trend
- looks not like C, but is C
Head: Color phasic
- blue: Cycle - W1-Activity
- violet: Level - D1-Activity
- Arrow = ver: Cycling/ hor: Leveling
- Divisor = ver: Stator/ hor: Rotor
- please recognize Frame and Inlet (Cause + Effect)
The small central Number marks the Time-Deviation Server/ Terminal.
- No Deviation = · = dot if not
- Deviation < 9 sec = Seconds
- Deviation > 9 sec = ×
This Difference can be caused by either Side, because it measures
- current Server-Time against current System-Time.
Consequently it is also an Indicator, how precise the System-Time is adjusted.
Modern OS come with the Functionality of Time-Setting by atomic Clock-Data.Please refresh sporadic the System and/or in Case of questionable Results.
Ensuring that delivers precise Notation about Deviations/ Differences/ Offsets.
Layers
projective Reflection = reflective Projection
The Card Deck:
Time Periods [TIME]
Toggle the framing Time - Display
- (colored by Channel Position)
- Button-Click on the top Time-Row
- changes operative Mode from Open to Close
- recognizable at Color of Poti-Frame
- and Color Switch of Channel-Ranges
- Hit Rate around 100% when Resizing Window.
- Reminds, which of both Components
- unalterable is the directive One.
- Button-Click on the bottom Time-Row
- toggles Moving Averages
- first Click minus W1
- second Click minus MN
- third Click all back
Price Positions [PROD]
Toggle the relative Price - Values (related to W1-Channel)
An Inversion of the Price-Component is accessed by Click on the Propeller Head.
Tick Bars [TICK]
Toggle Background Histogram (bright-gray)
- notes VPP-Deviation < or > 15% to prior Period.
= Phase -
- Acceleration [+]
- Deceleration [-]
- individual State (+/-) irrelevant
- due to resulting absolute PhaseChange
- Appearance of a bright Bar notes
- Center-Work, which is defined as decisional = intersecting.
Channel Moves [CHN]
The Rectangles operate in the W1-Channel
Color:
- defined by Channel Position/ Break of Band
- violet = Step/ D1-Move/ Trace-Trend
- blue = Lift/ W1-Move/ Trend-Trend
- white = Null/ MN-Move/ Trace-Trace
- orange = Full/ H4-Move/ Trend-Trace
Adjust the Visual
- Fill Rectangles (or not)
- set Linestyle/ -width
by Integer in the last Section.
Moving Averages [MOV]
that means: the Subwindow-Scalation is valid related to the Phase of the Component.
They cooperate and affect their passing Neighbor interdimensional,
- depicted as Color-Overtaking, if they pass near enough.
Their relative Movements reflect the actual leading Priceline/s.
They show in Cooperation with the framing Clock the Time.
Period Event Notation [PEN]
The Period-Trend is related to the MN-Channel and
- builds a directional HI-LO - Grid according to the
- actual RH/ MH/ ML/ RL - Development.
- D1-Price in Relation of the Monthly Channel results as
- exponential Translation of internal Period-Positions (of OHLC).
Pre-Adjustments of inverted Nature:
- Inversion/ MirrorView initially off
- toggle separately for every Component
Adjustments of general Nature:
- toggle the Visual of the Channel-Moves (filled/ lined Rectangles)
- toggle the Display of the Productivity-Potential (colored Position without Value)
- The Descriptive Mode is useful for Orientation or Confirmation (of not finally settled Experience).
- The MT4-Scales are a "fundamental Adjustment". In particular not resolvable for me. Mine is time-sensitive.
Integer/ Double
constant variable = variable constant
The Icing:
- preadjust Styles/ Widths/ Fontsize (Effect limited)
- Time-Deviation: Server-Terminal (in Hours)
- Initial Timeframe: self-explaining
logiclaboratory studio
© 2018-2023 /thiejden.

Extremely useful and incredible tool! I don't understand how this doesn't have 5 star reviews yet! It has totally changed the accuracy of my entries! Thanks to the author!