Orion Dynamic Keltner
- インディケータ
- Joao Paulo Botelho Silva
- バージョン: 1.0
- アクティベーション: 5
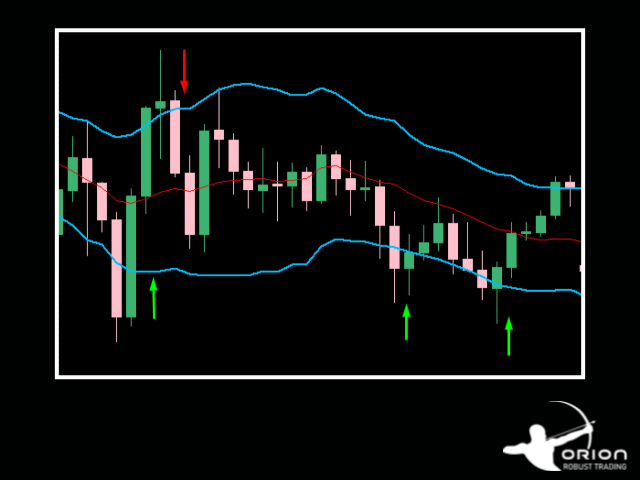
Theoretical Foundation
The Keltner Channels are channels ploted using volatility deviations above and bellow a moving average.
The indicator is an excellent tool to help the trader build trend and mean-reversion strategies.
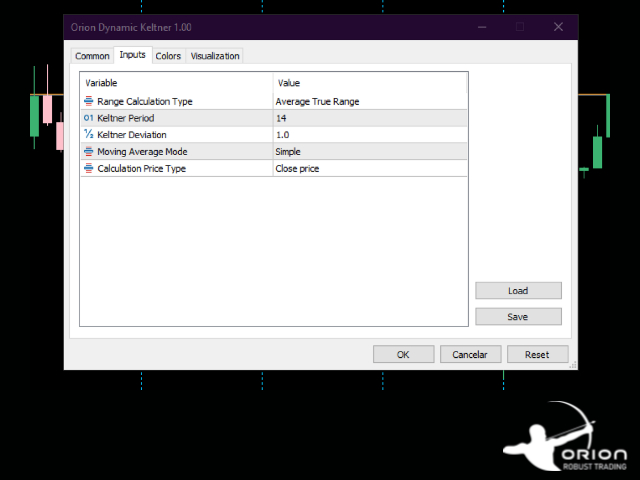
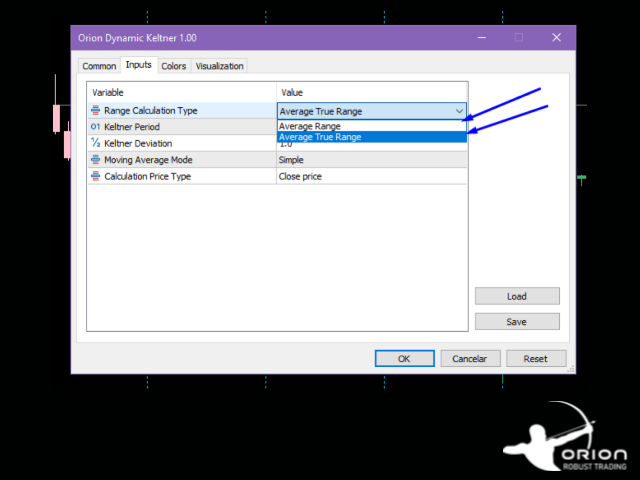
Parameters
The Orion Dynamic Keltner allows the user to select the Volatility Calculation Type, being ATR or Average Range (not considering price gaps).
Also, the user can select the Calculation Period, Number of Deviations, Moving Average Mode and the Moving Average Calculation Price Type.