Market Steps MT5
- インディケータ
- Mahdi Ebrahimzadeh
- バージョン: 5.50
- アップデート済み: 19 6月 2024
- アクティベーション: 5
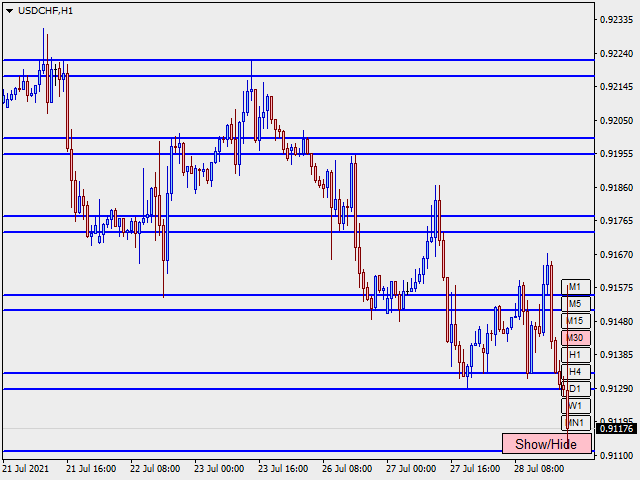
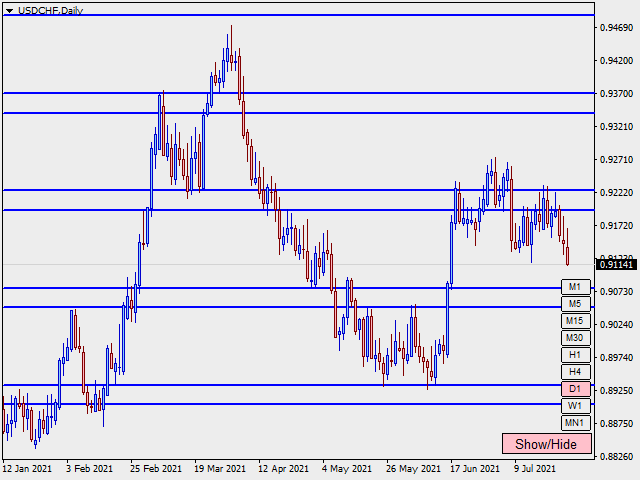
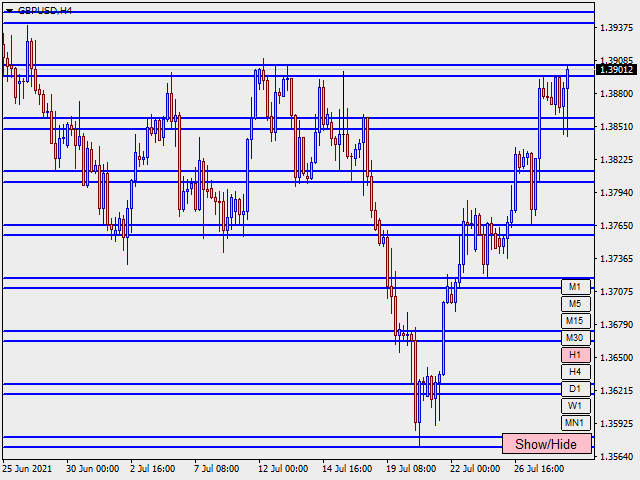
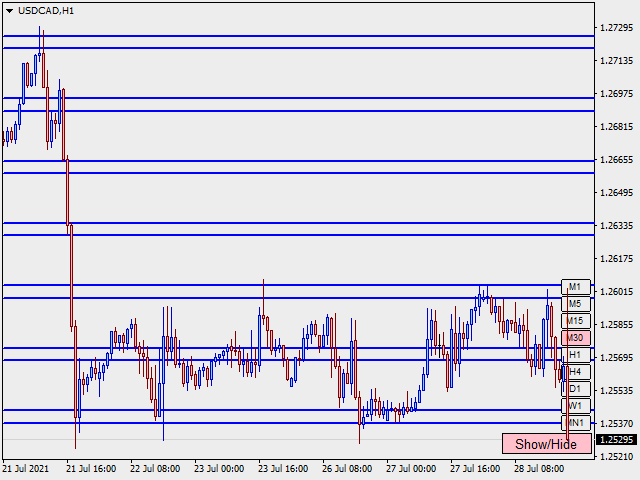
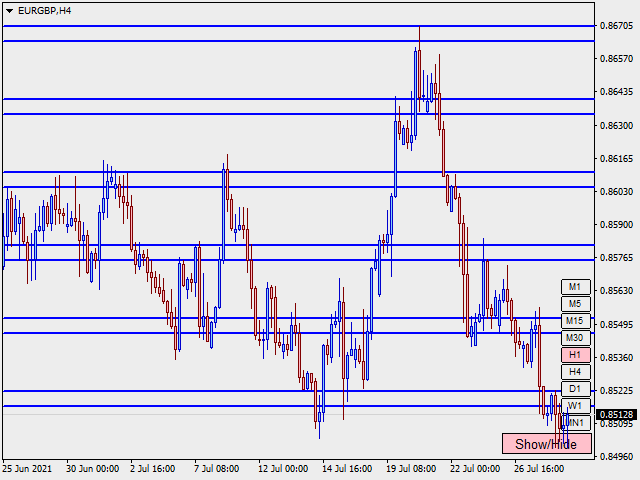
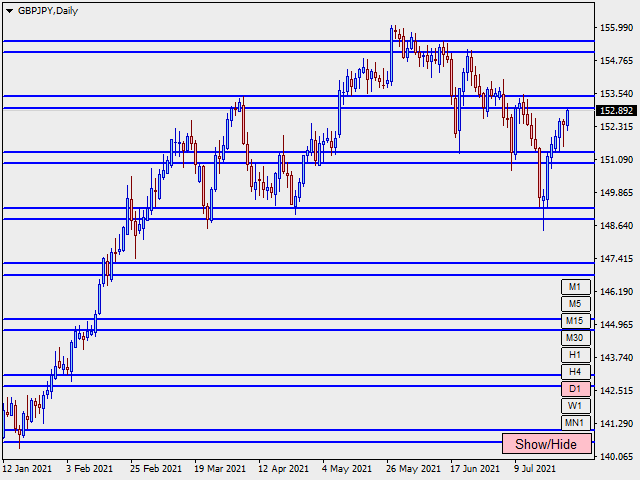
マーケットステップスは、Gannの時間と価格の相関関係に基づいて設計・構築され、プライスアクション特有のルールによって最適化されたFXマーケット用のインジケーターです。マーケットオーダーフローの概念を利用して、注文が集中する可能性のある価格帯を予測します。
インディケータ・レベルは、それ自体を取引に使用することも、他のストラテジーやインディケータの間違ったシグナルをフィルタリングするための組み合わせとして使用することもできます。すべてのトレーダーは、マルチタイムフレーム(TF)ゾーンと値動きの可能性をチャート上にまとめるために、このような強力なツールを必要としています。テスターモードでは、そのレベルがチャート上でどのように価格を支配しているかを試すことができます。
インジケータの利点
チャートに2つの異なるゾーンを表示し、異なるTFに対してトレンドとレンジ相場を指定することができます。
プライスアクショントレーダーは、異なるTF/プライスゾーンでのオーダーフローを確認したり、FTR(Fail To Return)/FTC(Fail To Continue)を確認するために使用することができます。
市場のボラティリティーとリキッドゾーンは、将来の価格変動のためにチャートに表示されます。
SL/TP、Trailing、Breakeven、Profit Savingが簡単に決定できます。
価格の反転や継続を簡単に確認できます。
インディケータのレベルは、マーチンゲールまたはグリッドレベルとして、より高い確率で使用できます。