Harmonic Papallons Pro MT5
- インディケータ
- Ramon Sobrevals Arce
- バージョン: 2.10
- アクティベーション: 5
Automatically scans the chart to find Harmonic Patterns, and give you the chance to enter early in good operations. Also if selected, it will alert you in advance when future patterns appears, showing you a projection of a posible future pattern.
The main goal for this algorithm is to determine with high precision the moment when a trend ends and a new one begins. Giving you the best price within a reversal.
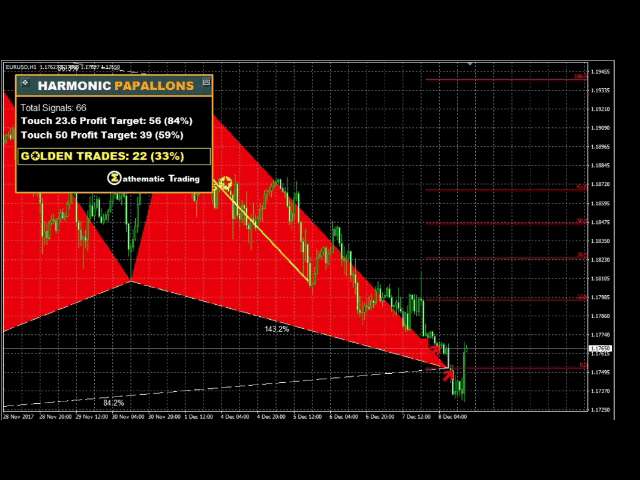
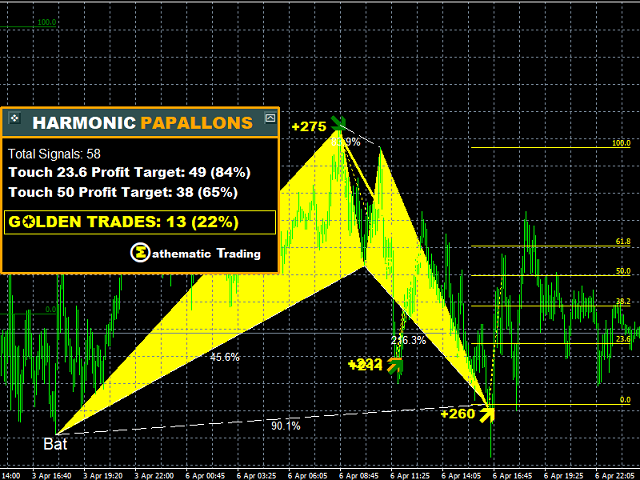
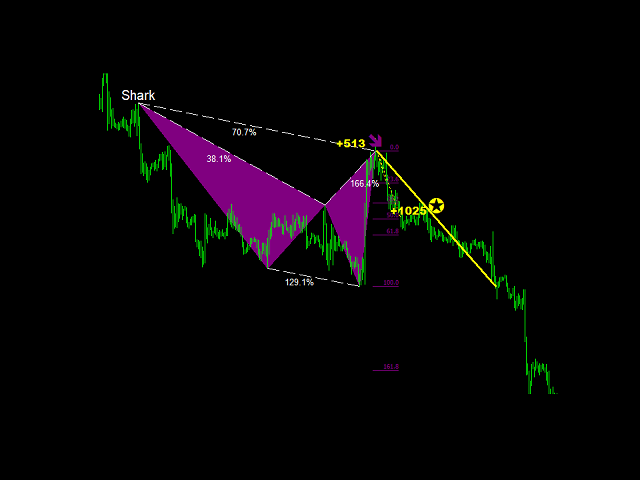
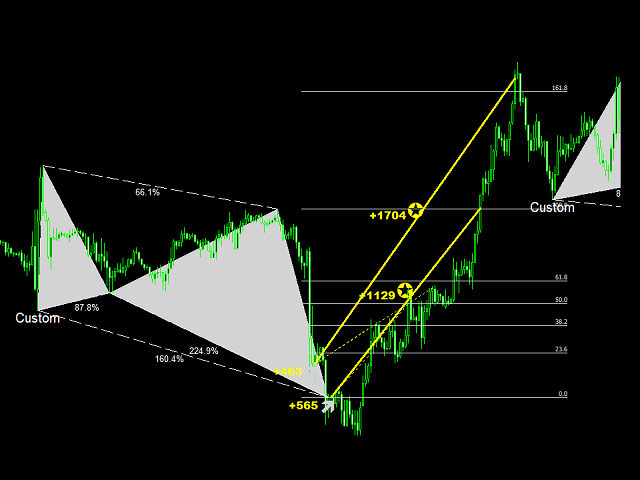
We have added the "Golden Trade", we define it as the perfect order: For those orders that had the perfect entry price. They were always in profit, or the final profits are much much higher than the possible losses. Through the settings you can select different parameter (proportions) of golden trade production (more information).
- The trading system is suitable for experienced traders and beginners.
- The signals can be used for manual trading (short-term or long-term trading), scalping or binaries.
Unique features:
-
Ready to be used in Expert Advisors
-
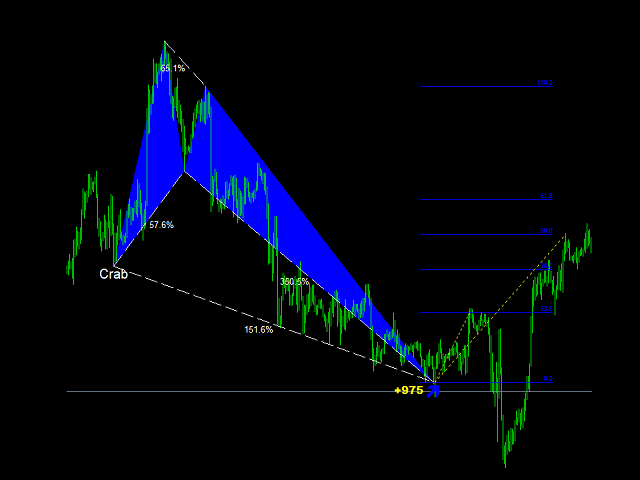
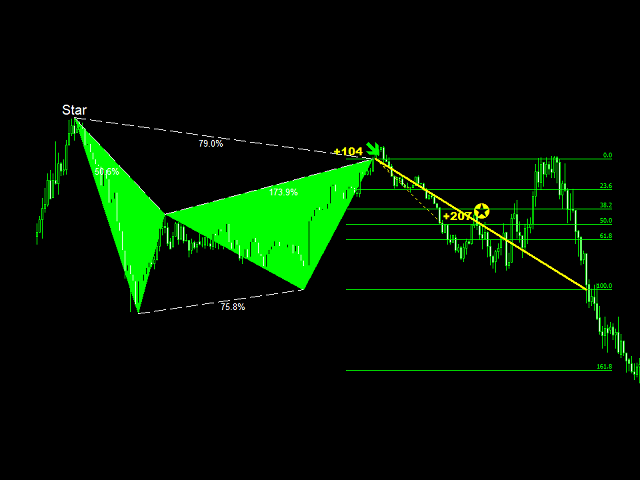
7 included patterns (Butterfly,Gartley,Crab,Bat,Cypher,Shark,Star) + customer pattern
-
Simple format settings
-
It has arrows that point the best moment to buy/sell
-
Optimized, high speed: it can be backtested really fast
-
It shows future patrons before created
-
It points when the price will reach the point to make the reversal
-
Ready to be used in many Time Frames and Pairs
-
Sound Alerts if desired
-
No repaintings
-
It includes a Dashboard
Recommendations:
-
Do not operate against a strong trend
-
Once you have your operations, we recommend to use some type of trailing.
-
Settings: Set up between a 10-15% of tolerance. Increase it if you want to have more patterns.
How to Use it:
Step 1.- Attach the indicator and select the settings that works better for you:
.- Select the patron to be shown by clicking true/false
.- Select the level of tolerance (recommended 10-15%) level of precision to miscalculation
Step 2.- Wait for a signal:
.-Wait for a colored confirmed Pattern and decide to trade.
.-Wait for Posible Pattern (not colored); Get ready to trade if the price reach the point; Use it to confirm your trend.
Input Parameters:
- Maximum Number of Bars to Calculate: Maximum Bars to look for Harmonic Patterns. 0 means the whole chart. We recommend lower values for faster backtesting.
- Hide all Patterns : Show or hide the patterns and only show the arrows.
- Visuals From Older Patterns : To visualize in the chart the older patterns.
- Hide Patterns When Overlap : To hide the patterns when they overlap between them for more clear charts.
- Show Fibonacci Projection : When the pattern appear, the possible Fibonacci Projection will be displayed to set TP or SL levels.
- Zig Zag Settings : Zig Zag inputs used for the calculation of the Patterns
- Pattern Proportions Tolerance : Tolerance percentage (or error accepted) for the ratios normally used for the harmonic patterns.
- Custom Pattern : Relation of the Price Retracement to define one custom Pattern
- Show Possible Future Patterns : To show the possible future patterns. Bigger the percentage, sooner it will show a possible pattern.
- Show DashBoard: Show or hide the Dashboard.
- Fibo Take Profit Target: Fibonnacci level to define the possible Take Profit (for the Dashboard simulation)
- Fibo Stop Loss Target: Fibonnacci level to define the possible Stop Loss (for the Dashboard simulation)
- Golden Proportion: Minimum relation between and “profit” and “loss” to be considered one Golden Trade.