Alpha Trend Spotter
- インディケータ
- Andy Ismail
- バージョン: 208.19
- アップデート済み: 26 8月 2019
- アクティベーション: 5
This is an indicator for finding the strongest trend each day, suitable for intraday trading or a swing trading.
See the live performance at : https://www.mql5.com/en/signals/93383
How to Use:
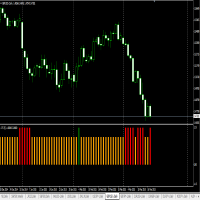
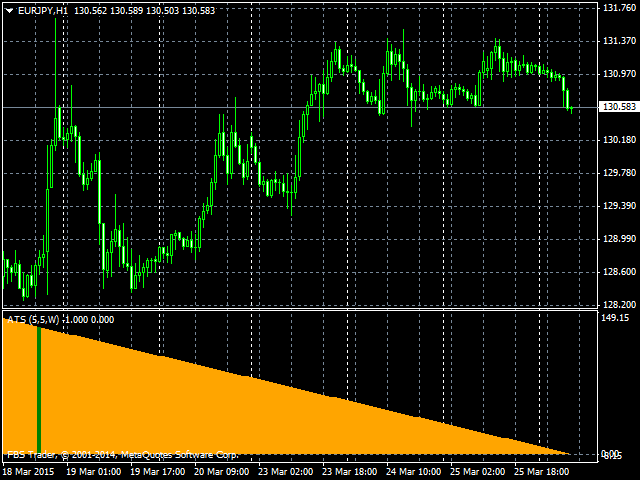
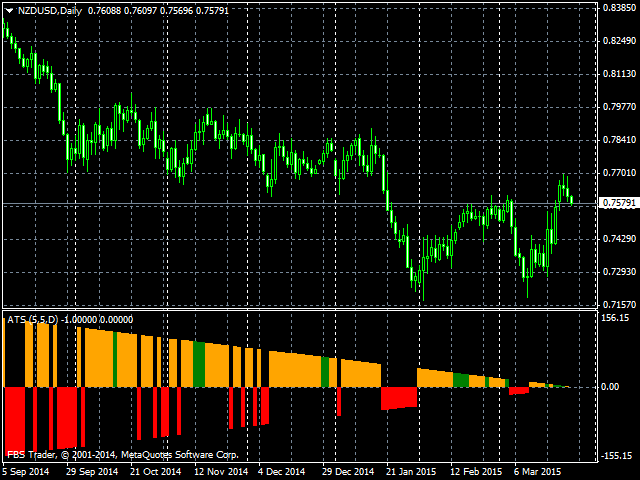
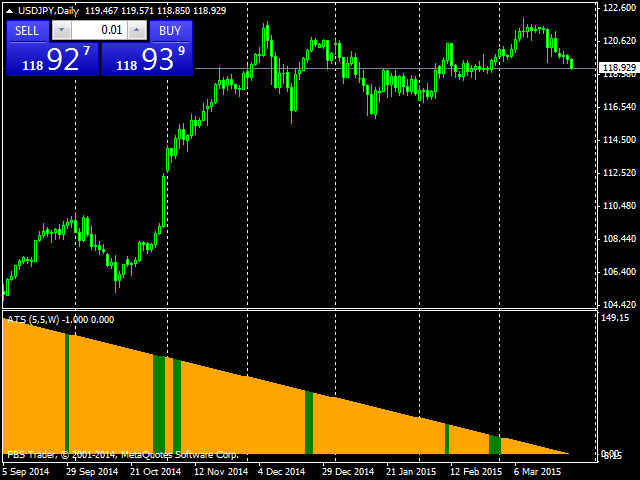
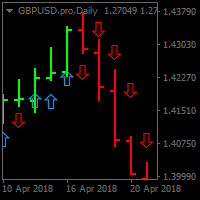
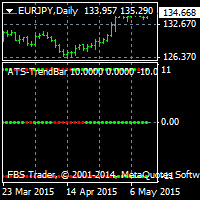
- RED BAR means Bearish Trend for the next candle
- GREEN BAR means Bullish Trend for the next candle
- ORANGE BAR means Sideways Trend for the next candle
Example:
If we are using D1 timeframe, see the last BAR, if the bar is RED BAR, open short/sell for today.
If we are using H1 timeframe, see the last BAR, if the bar is GREEN BAR, open long/buy until next hour.
You can сombined it with Parabolic SAR Indicator for helping you to place the TP & SL.
