Price Channel Mt5
- インディケータ
- Ruslan Latypov
- バージョン: 3.0
- アクティベーション: 10
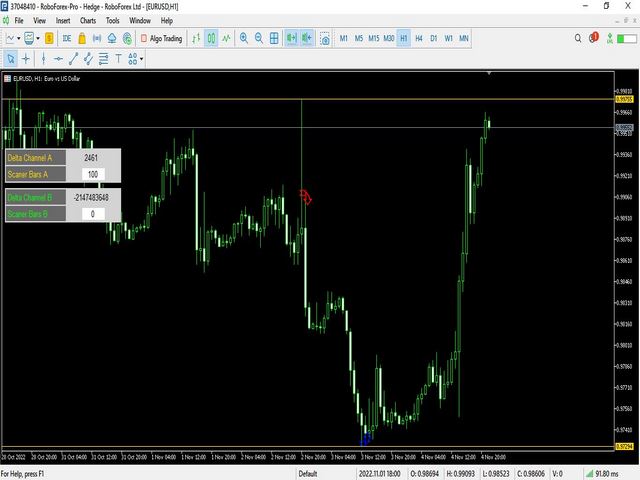
プライスチャンネルは、2つの独立したプライスチャンネルとプライスゾーンのレベルで構成されています - (A / B). このインジケータは、常に価格の挙動と動きを監視し、チャネルレベル(A / B)の破壊、レベルの再配置、極値および極小値の新しいゾーンの固定を行います。
以前の高値と現在の安値の分析については、各チャンネルのバーの数 - (A / B)に依存することはありません。
チャート上の各チャンネルに有用な情報を表示するインジケーターです - (A/B)。
1. 各チャンネルの解析で指定されたバーの数。
2. デルタ - 各チャンネルのレベル間の距離。
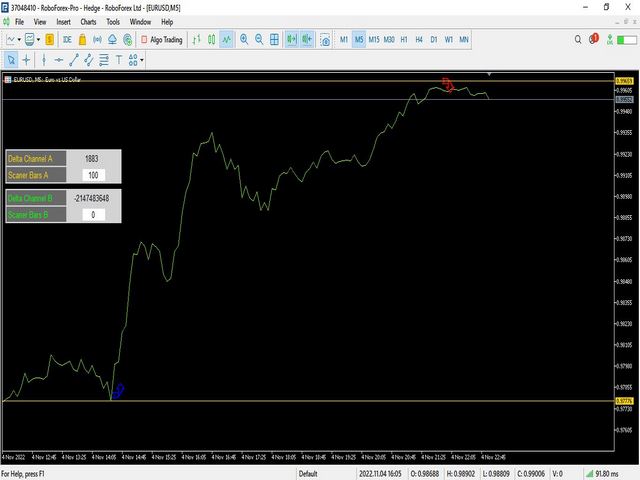
1. インジケータのアプリケーション例:最大値と最小値(上または下)のゾーンと新しいローカルレベルを検索して更新するために、チャネルで - (A)は、範囲を指定します - (100 - 500)バー例えば。チャンネル(B)は使いたくないので、チャンネル(B)には(0)バーを表示します。
B)チャネルの水準は、チャート上では消えてしまい、私たちの邪魔をすることはありません。
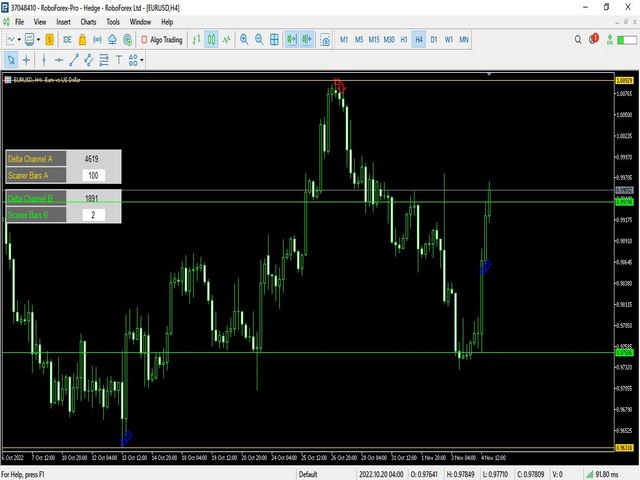
2. インジケータアプリケーションの例:狭い廊下で価格とフラットのブレークを追跡する場合、チャネル(B)で我々は、例えば、範囲(1-5)バーを指す。
(0)のバーにはチャンネル(A)を使用する必要はありません。
A)チャネルの水準は、チャート上では消えてしまい、私たちの邪魔をすることはありません。
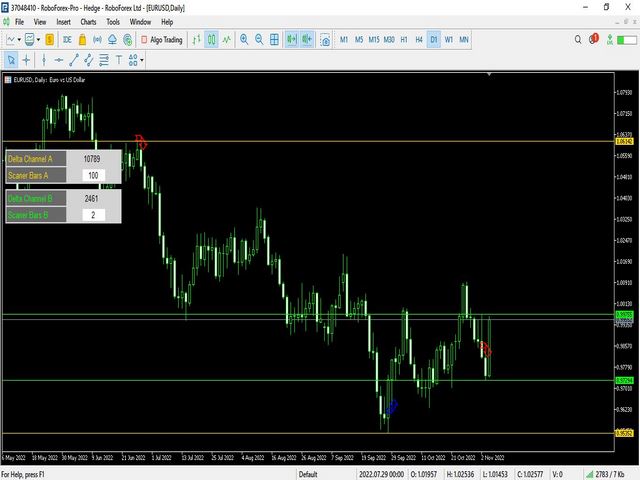
3. 例 インジケーターの使用例:チャンネル - (A / B) で、異なるバーの範囲を指定し、それぞれのチャンネルを独自の目的で割り当てることができます。
Indicator Price Channelは、著者のExpert Advisorを書き、使用する際に、手動および自動売買のための8つのシグナルバッファを備えています。アイデアと私の著者の指標の基礎として使用することができます - 価格チャネル。この目的のためにインジケータを購入する場合、私にメールをいただければ、Expert Advisorのリソースとしてインジケータを呼び出すために必要なすべてのパラメータをお送りします。
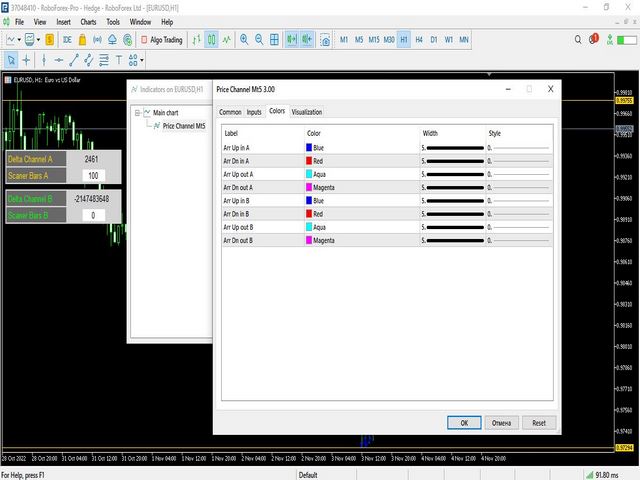
チャンネルの外側と内側のブレイクアウトレベルの信号があります - (A / B).
チャンネル(A / B)にはそれぞれ独立した信号バッファがあります。
SetIndexBuffer(0,ArrUpInA)を設定します。
SetIndexBuffer(1,ArrDnInA)を設定します。
SetIndexBuffer(2,ArrUpOutA)を設定します。
SetIndexBuffer(3,ArrDnOutA)を設定します。
SetIndexBuffer(4,ArrUpInB)を設定します。
SetIndexBuffer(5,ArrDnInB)を設定します。
SetIndexBuffer(6,ArrUpOutB)を設定します。
SetIndexBuffer(7,ArrDnOutB)を設定します。
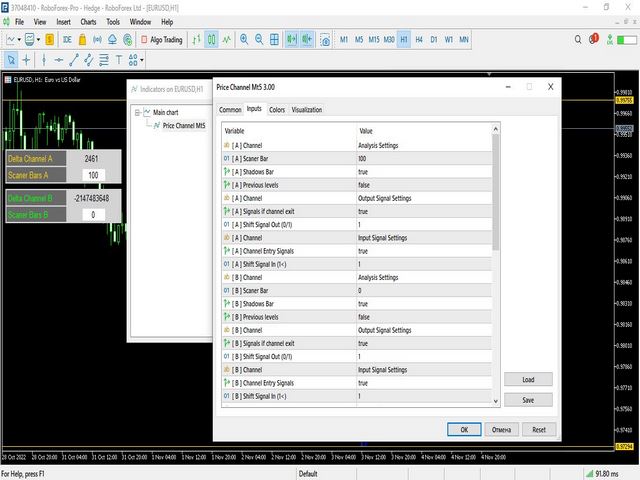
インジケーターの設定 - プライスチャンネル:
[A ]チャンネル「解析設定
[A ] スキャナーバー
[A] シャドウズバー
[A ] 以前のレベル
[A ] チャンネルの「出力信号の設定
[A ] チャネルが終了した場合の信号
[A] シフト信号出力(0/1)
[A] チャンネル「入力信号の設定
[A】チャンネルエントリーシグナル
[A ] シフト信号入力 (1<)
//---
[B ]チャンネル「解析設定
[B ] スキャナーバー
[B】シャドウズバー
[B ] 以前のレベル
[B ]チャンネル「出力信号の設定
[B ] チャネルが終了した場合の信号
[B] シフト信号出力(0/1)
[B ]チャンネル「入力信号の設定
[B ] チャネルエントリーシグナル
[B ] シフト信号入力 (1<)
//---
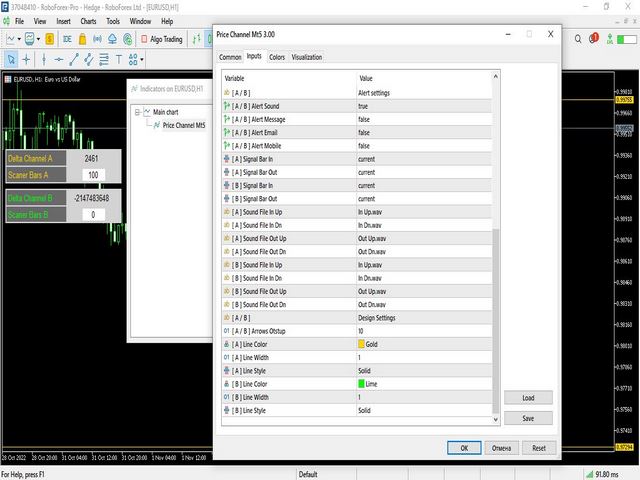
[A / B ] 「アラート設定
[A / B ] アラート音
[A / B ] アラートメッセージ
[ A / B ] アラートメール
[A / B ] Alert Mobile
//---
[A ] シグナルバーイン(カレント/クローズ)
[A ] シグナルバーアウト(カレント/クローズ)
[B ] シグナルバーイン(カレント/クローズ)
[B ] シグナルバーアウト(カレント/クローズ)
//---
[A] Sound File In Up
[A] Sound File In Dn
[A] Sound File Out Up
[A ] サウンドファイル出力Dn
[B] Sound File In Up
[B] Sound File In Dn
[B] Sound File Out Up
[B ] サウンドファイル出力Dn
//---
[ A / B ] 「デザイン設定
[A / B ] アローズ・オットストップ
[A] ラインカラー
[A] 線幅
[A] ラインスタイル
//+------------------------------------------------------------------+
私のオーサリングアイデアとワーキングツールに注目していただき、ありがとうございます。