BPS Break of Structure MT5
- インディケータ
- Barend Paul Stander
- バージョン: 1.4
- アップデート済み: 5 6月 2024
- アクティベーション: 5
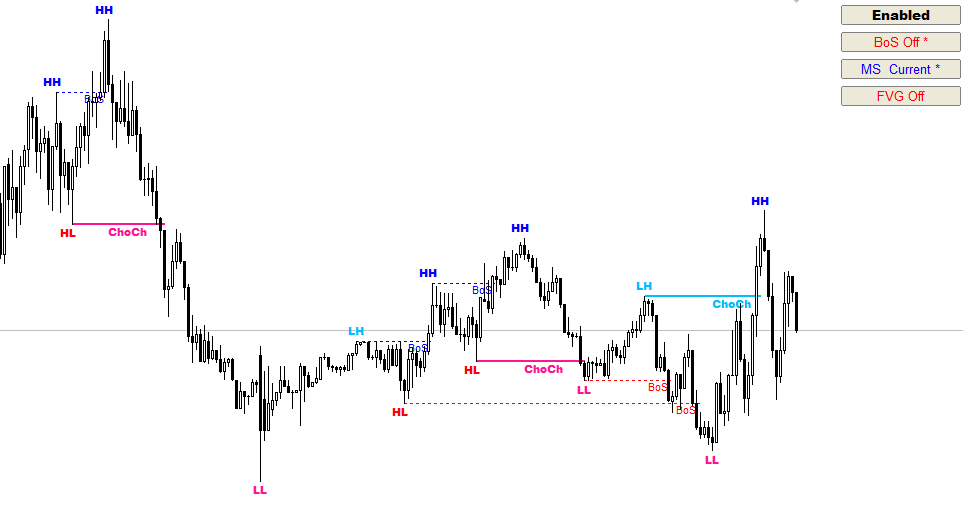
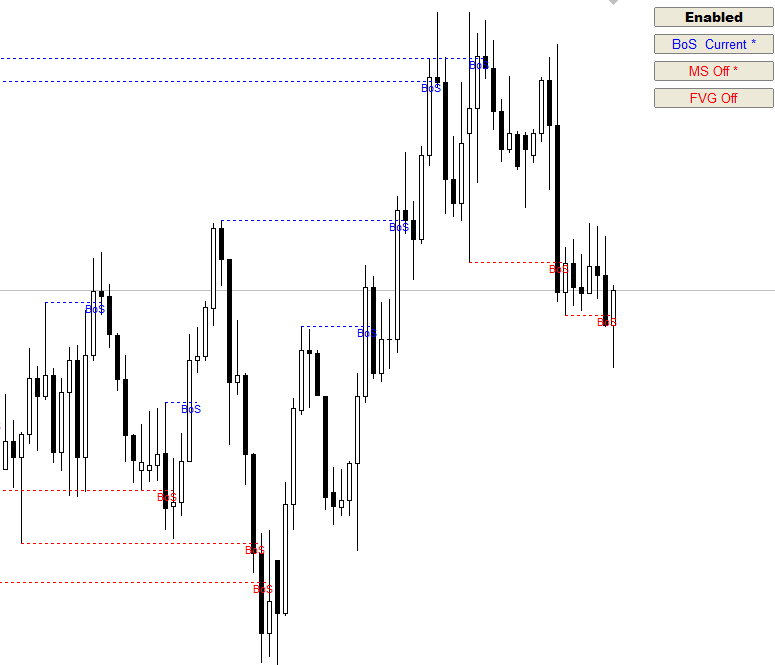
BPS BoS - Break of Structure
- BoS - Fractal mode , MTF
- BoS - Zigzag mode , MTF
- Show HH and LL
- Alerts - Popup , Push notification and eMail
- Option to create screenshot on alert
- Enable / Disable Indicator with a button on chart to select options
- Choose corner of button location
It is not a system but a indicator to help identify break of structure points
MT 4 Version : https://www.mql5.com/en/market/product/78420?source=Site+Profile+Seller
Other Indicators : https://www.mql5.com/en/users/fx_1/seller

Amazing product! I personally have been trading the break of structure for over 2 years now, and I was excited to come across an indicator that had similar concepts. After using it for about 15 days now, I can say that it works beautifully!