Divergence Detector for MT5
- インディケータ
- SQUAWKTRADEFX, LLC
- バージョン: 1.2
- アクティベーション: 5
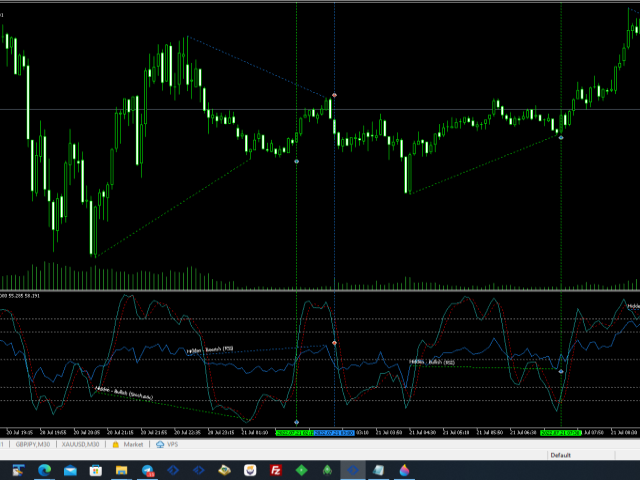
Divergence is one best ways to trade the financial market as it is a leading indicator of price action that detect high probability reversal and continuation setups.
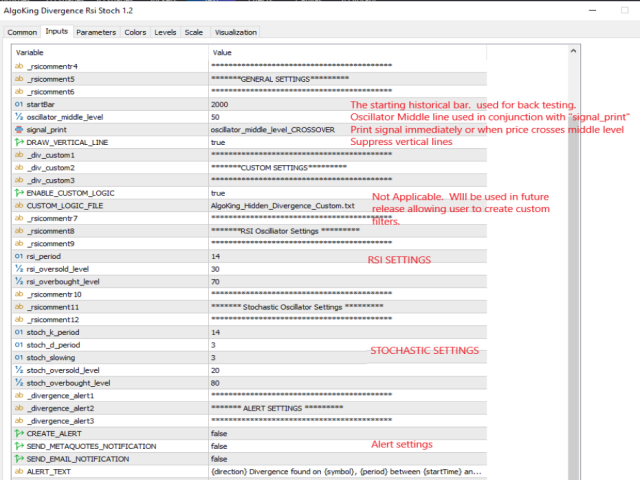
The AlgoKing Divergence Detector is an RSI and Stochastics Indicator with Divergence Detection.
Features
- Hidden Divergence for trend continuation.
- Standard or Normal Divergence for trend reversal.
- Screen Alerts.
- MetaQuotes Notifications.
- Email Notifications.
- RSI Indicator built in.
- Stochastics Indicator built in.
Types of Divergences
- Hidden Bullish Divergence - Hidden bullish divergence happens when the following two factors align … First, the indicator makes lower lows. Second, the price chart makes higher highs. This can mean the price action will soon reverse to the downside.
- Hidden Bearish Divergence - Hidden bearish divergence happens when the indicator makes higher highs and the price chart makes lower highs. This can mean the price action will soon reverse to the upside.
- Regular Bullish Divergence - Regular bullish divergence happens when the indicator makes higher lows and the price chart makes lower lows. This can mean the price action will soon trend upward.
- Regular Bearish Divergence - With regular bearish divergence, the indicator makes lower highs and the price chart makes higher highs. This can indicate the price action will soon trend down