Shape Pack MT5
- インディケータ
- John Louis Fernando Diamante
- バージョン: 1.0
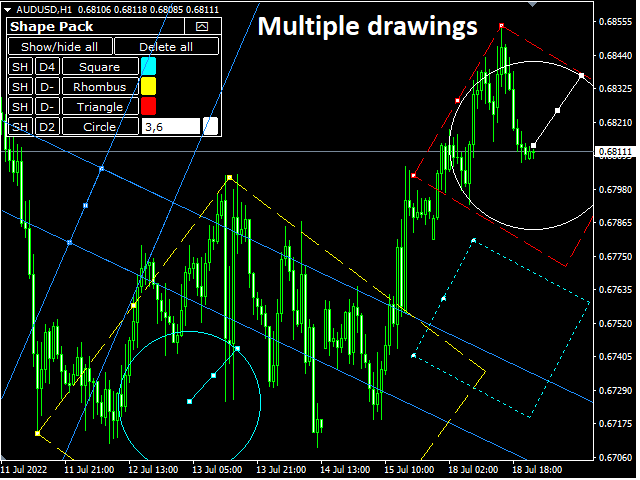
This indicator provides common shapes as drawing object options. The shapes are rotatable, resizable, draggable, and will keep their proportions (according to their handle trendline) across different chart scales. Multiple drawings are supported.
- Square
- Rhombus
- Triangle (quadrilateral & isosceles)
- Circle (grid, overlapped grid, flexi grid, rotatable grid, concentric circles)
Features:
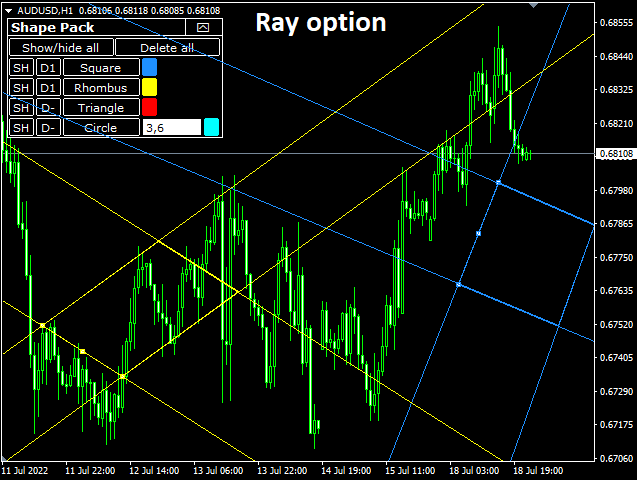
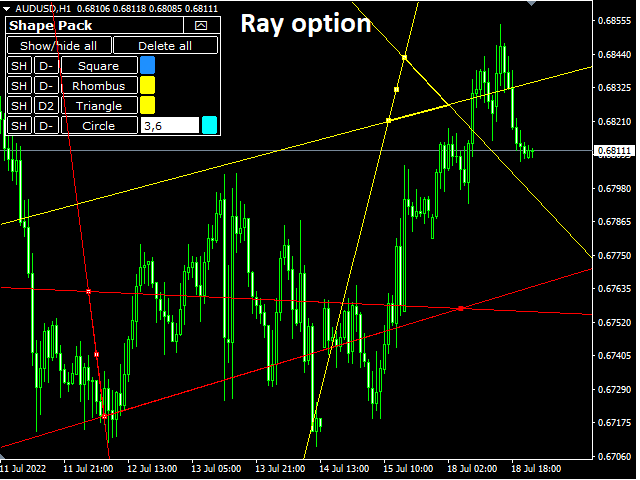
- rays (all object edges will be rays)
- show/hide each individual drawing type, or all
- delete last drawn object, or all
Styling:
- each object has it's own styling options
- color, style, width (circle has just a color option)
- a different style can be applied to each new drawing
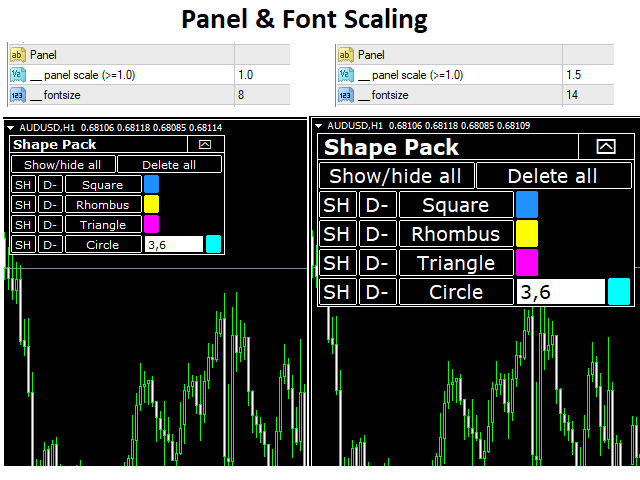
Panel:
- stylable, scalable in size and font
- movable and can be minimized