Day Traders Master Board
- インディケータ
- Elias Mtwenge
- バージョン: 1.200
- アップデート済み: 5 8月 2022
- アクティベーション: 15
Reminder: After purchasing the unlimited version of this indicator send me the proof and I will add you to my private group so that you join the community and continue to learn more about this tool and grow together with other traders. You will also learn the strategy that will change your trading story!
Dear Traders I am so glad to introduce my forex trading product called "Day Traders Master Board". This tool is designed for serious traders of any trading strategy. My goal is to help trader become successful in their trading business. Thank you!
Function of the Indicator.
- The indicator will show you the major direction of trend for 28 forex currency pairs and at multi-timeframes.
- As a quick chart open tool. You can quickly open any chart on your MT4 by just choosing timeframe, pair and clicking on the trend signal box
- The indicator has a scale that gives a meaning to those trend signals (whether strong up trend, strong downtrend, weak uptrend and weak downtrend.
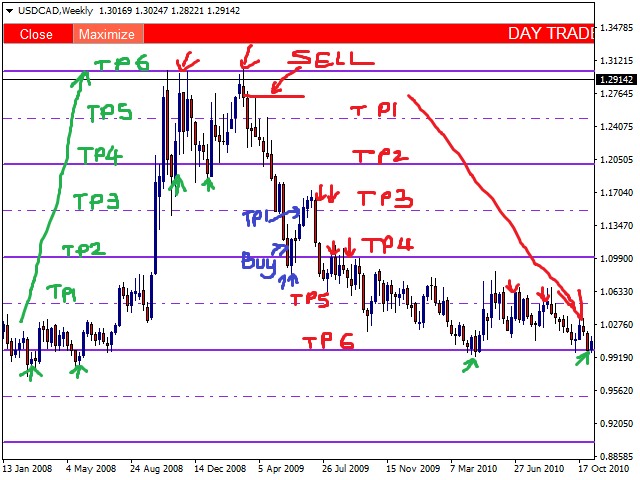
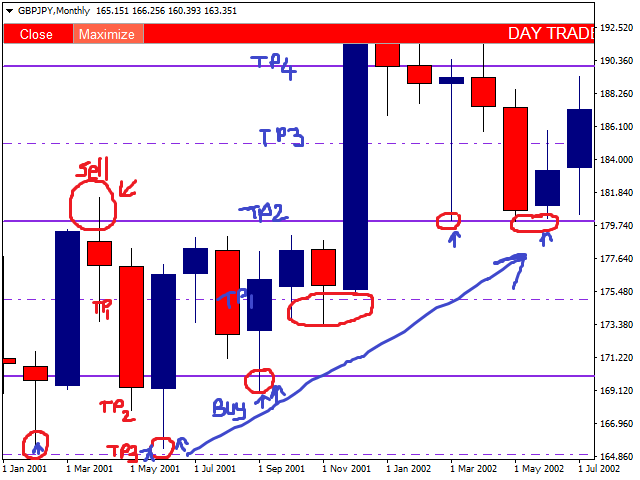
- The Indicator consist of level lines that will be used as FIBONACCI TOOL, SUPPLY AND DEMAND LEVELS or SUPPORT AND RESISTANCE LEVELS or SL and TP targets.
- MARKET CORRELATION. This tool can be used to check which current pairs correlate to each other at that specific timeframe bu just looking at the direction of the trend.
- AS A SENTIMENT CONTRARIAN INDICATOR. You may use this tool to go against the crowd by just targeting your trade entries in the direction of the trend indicated by this tool in a specific timeframe. Follow the trend and never go against the big banks by following the trend.
TIMEFRAME
- This indicator works on all timeframes known. There is no need of worrying about this.
INDICATOR SETTINGS
In the input section you can do the following
- You can minimize, maximize and close the Indicator by just clicking on the respective button on the indicator.
- You may choose to show levels by choosing "true" or may may choose to not show levels by choosing "false"
- You may choose to show levels automatically or manually but by default the levels are set automatically.
- You may also choose the interval between levels to solve the issue of clustered lines especially for higher timeframes as weekly and monthly for some pairs.
HOW TO USE THIS INDICATOR
A. The trend Screener
- You look at the trend screener to check the overall picture of where each pair is moving to at different timeframes.
- If you want to open a specific pair then you just need to click on the signal box and that pair will be automatically opened in the back of the indicator.
- Note that the trend direction should not be considered as a signal to open a trading position but other factors should be considered before entering a trade. The trend screener will just show the overall market direction and minor deviations or pullbacks may happen within that major trend before the real move in the direction of the trend starts to take place. Thus why I will introduce another indicator for entry signals. Check it below.
B. The level lines.
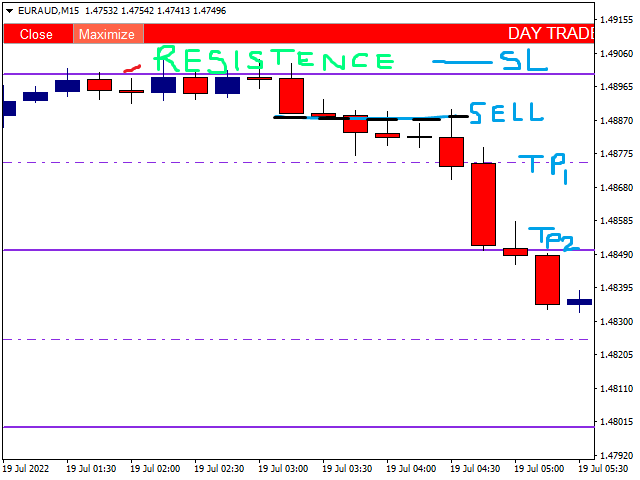
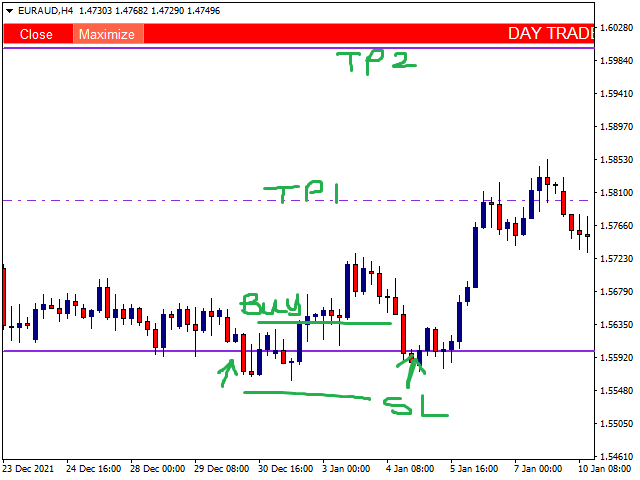
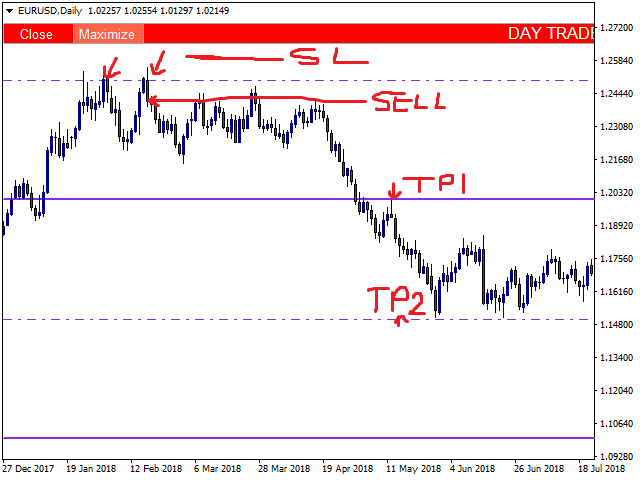
- There are two types of level lines (the dotted lines and the sold line).
- The sold lines will be used as the main support and resistance levels (supply and demand zones)
- If you open a sell position just below the sold line then your stop loss should go at the dotted line above the current sold line and the take profit 1 should be at the near dotted line below the entry sold line and the take profit 2 should go at the next sold line below the entry sold line and vice-versa for the sell position.
COMBINATION WITH OTHER INDICATOR
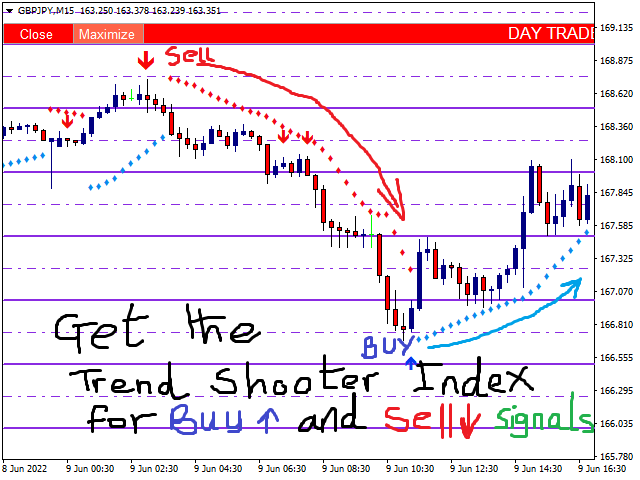
This indicator works hand on hand with my other new indicator called the Trend Shooter Index which shows sell and buy non repaint arrows.
This indicator will help you to decide the best entry signals and filter out the fake signals. When these two tools are combined together there is high chance of increasing the win rate and account growth. Therefore it is Highly recommended to get the Trend Shooter Index copy.
Note: For the Trend Shooter Index if you get a sell arrow and the trend phase is bullish you don't sell until the trend changes to bearish phase and if you get a buy arrow and the trend phase is still bearish phase then you don't buy until the trend phase changes to bullish phase.
Last word
- Forex trading is risky not every signal will be profitable 100% and loss may exceed your invested capital therefore you must use this tool with trading discipline and money management cautions. Otherwise, thank you for considering my products. I wish you the best experience with my product. Thank you.



























great product great customer support he really wants u to succeed