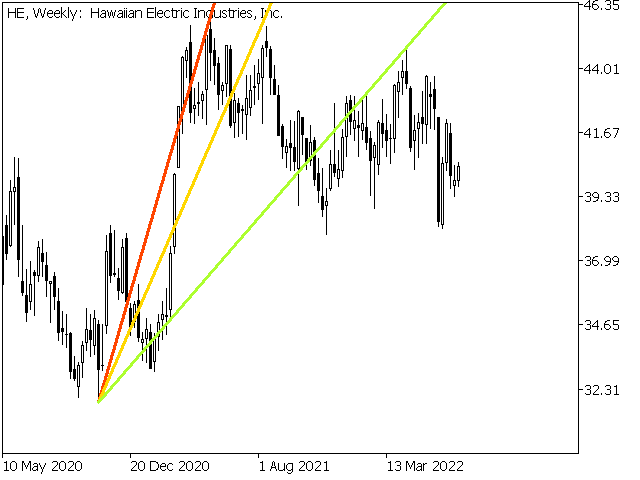
SRL Edson Gould
- インディケータ
- Grigorii Matsnev
- バージョン: 1.0
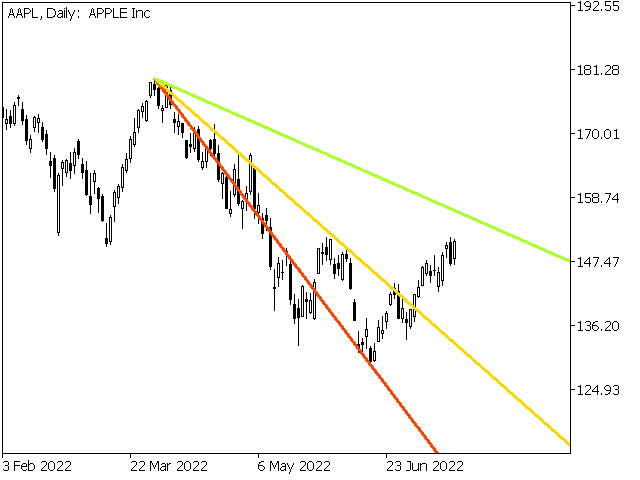
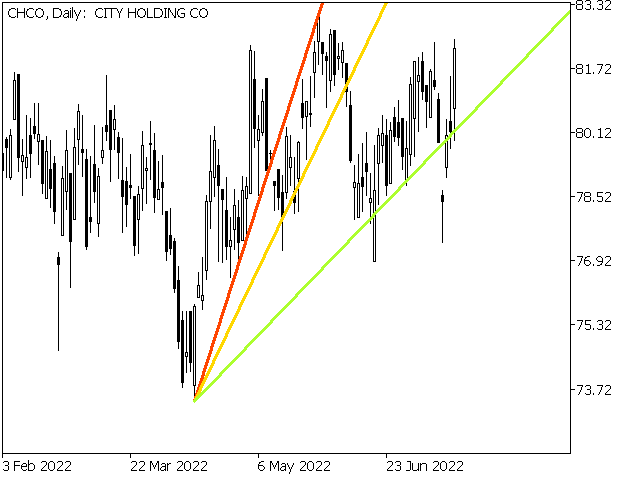
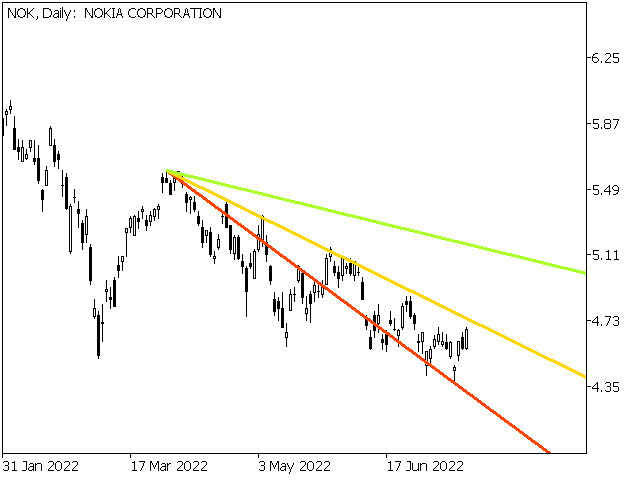
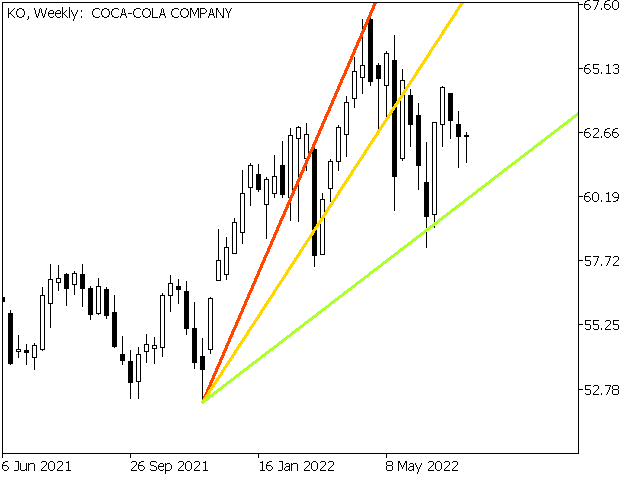
速度の抵抗ラインは傾向および抵抗ラインを定めるための強力な用具である。 この指標は、チャートの極値と特別な数式を使用して線を構築します。 指標は、トレンドの方向とピボットポイントを決定するために使用することができます。
<---------------------------->
指標パラメータ:
"Depth of search" -チャートの極端な検索の深さ(バー単位)
"Back step of search" -極端な間の最小距離(バー単位)
"Deviation of price" -同じタイプの両極端間の許容価格差
"Line color" -対応するインデックスを持つ線の色
"Line style"-対応するインデックスを持つラインスタイル
"Line width"-対応するインデックスを持つ線幅
<---------------------------->
あなたは本の中でより多くの情報を見つけることができます"エドソン*グールドによる希少な著作のコレクション"またはプライベートメッセージで私
<---------------------------->
興味のあるすべての人に事前に感謝し、市場を征服することに幸運を祈っています!

Very Brilliant indicator 👏 👌