
Synchronized Charts
- ユーティリティ
- Jinsong Zhang
- バージョン: 1.47
- アップデート済み: 20 11月 2021
- アクティベーション: 10
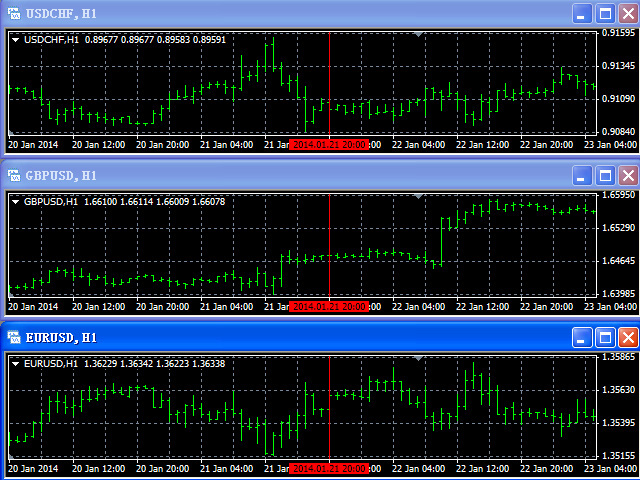
The Synchronized Charts script allows comparing bars of different symbols or different periods of the same symbol.
Attach the script to a chart and move bars or change the scale, all opened charts will move synchronously with the current one. The bars on different charts aligned to the border according to their open time.
Please be sure the relevant history datas have been downloaded before synchronize charts.


Incredibly useful tool for backtesting a single pair across multiple time frames as ‘the future’ charts are hidden when aligned to the right of the screen. F12 scrolls all time frames that are open simultaneously, allowing for multi time frame historic analysis - works very well.