Auto Trend Lines
- インディケータ
- Semion Tremsin
- バージョン: 1.6
- アップデート済み: 25 3月 2020
- アクティベーション: 5
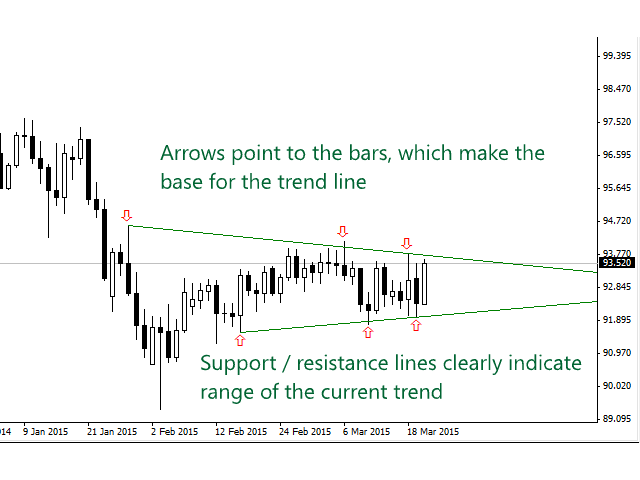
Simply drop the indicator to the graph and support and resistance levels will be shown automatically!
The indicator for automatic drawing of support and resistance levels based on THREE points.
- Identified points are marked on the chart
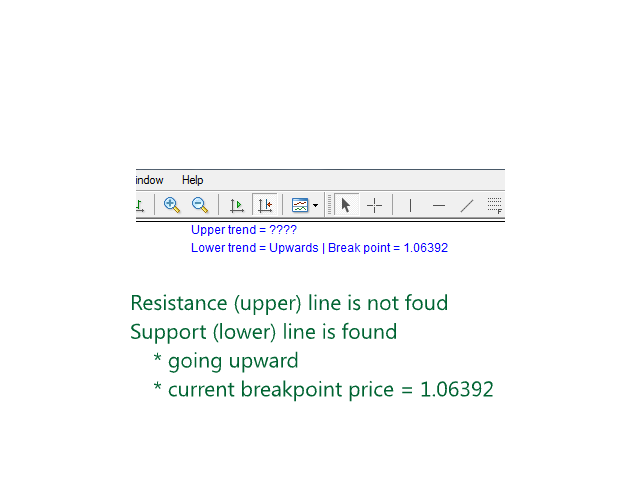
- Indicator shows break through price for both bullish and bearish trends (if found)
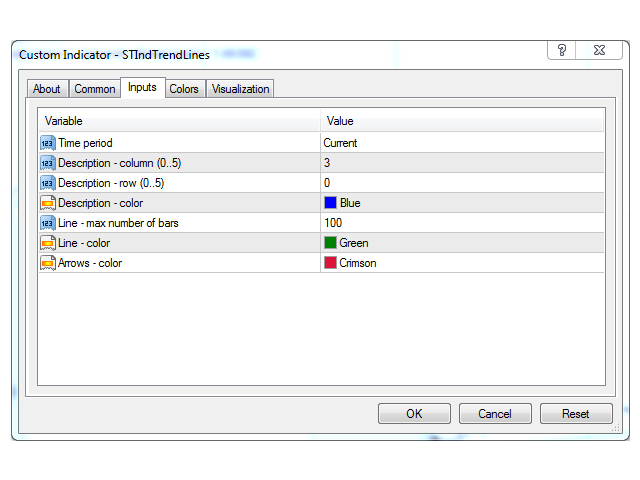
- You can specify on how many bars the indicator shall look in order to identify supporting points.
In addition, you can select on which time frame the indicator will work. That means, you can use H1 chart for your analysis while seeing trend and break through points from H4.
Please contact the author if you have any suggestions for improving the indicator.


