• 概要
  • レビュー
  • コメント (3)

Etalon Universal

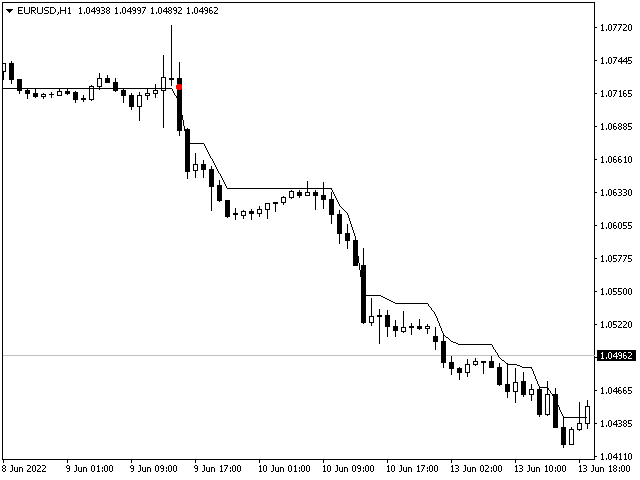
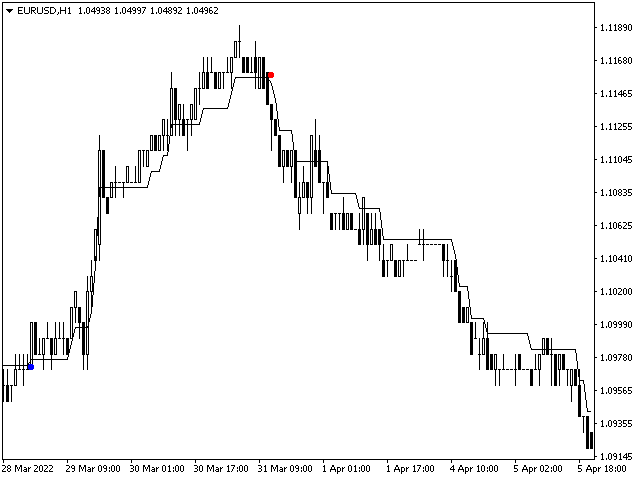
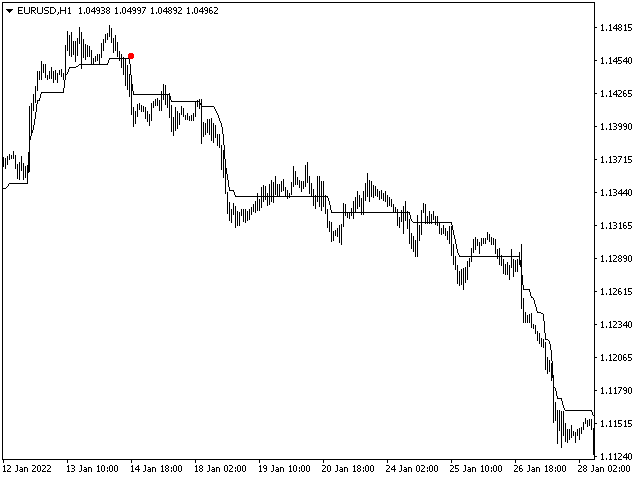
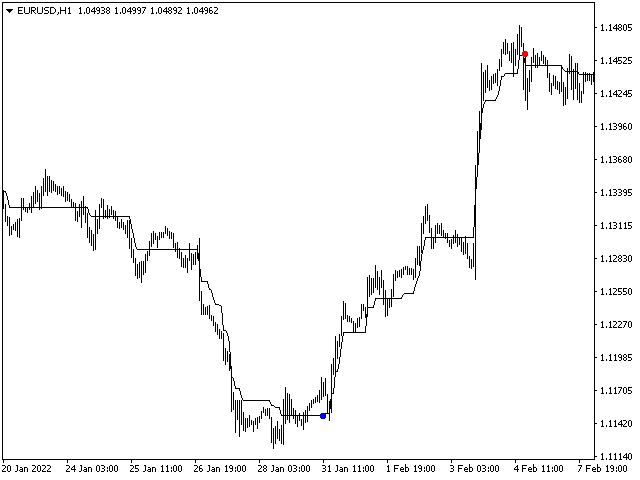
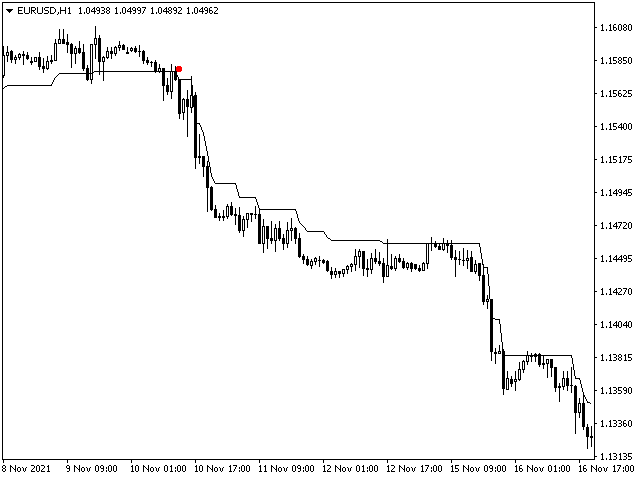
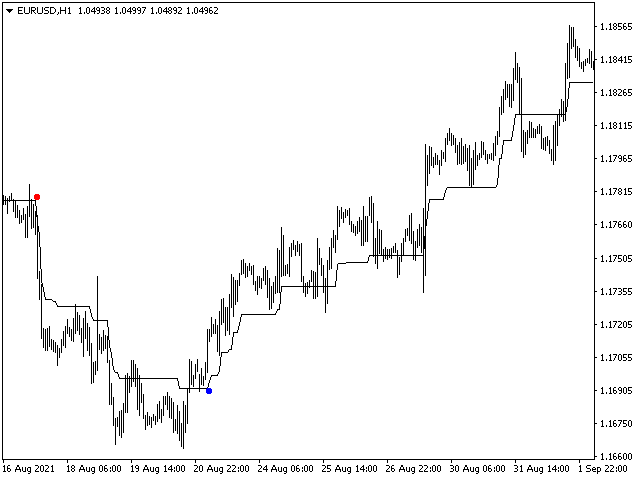
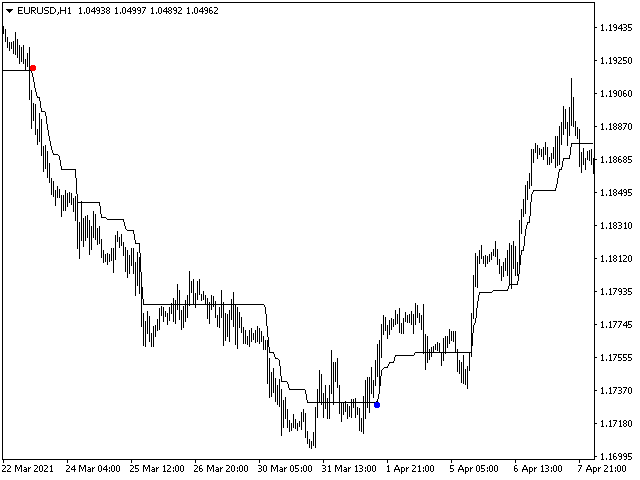
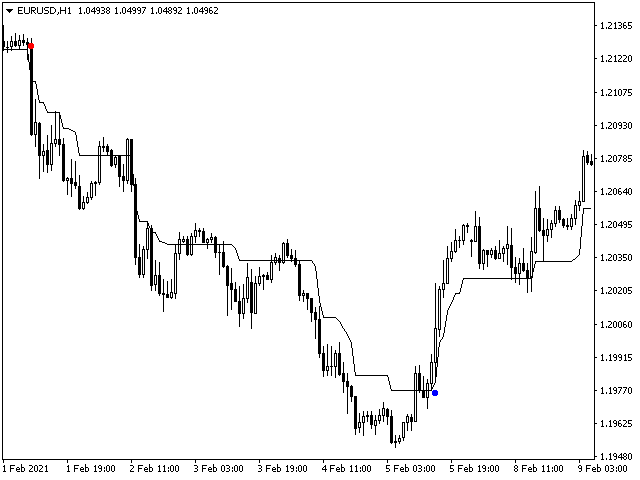
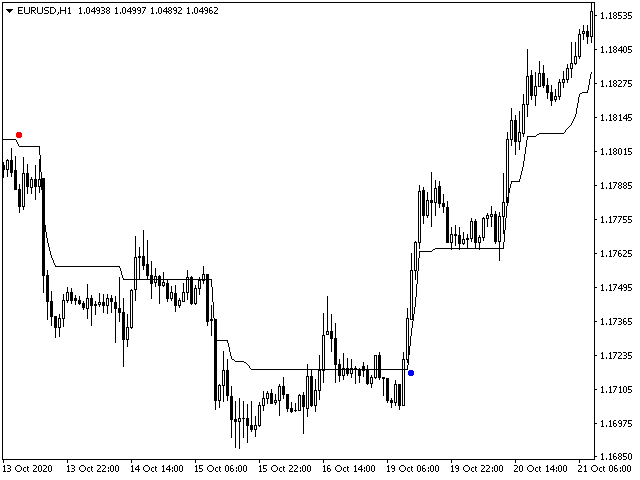
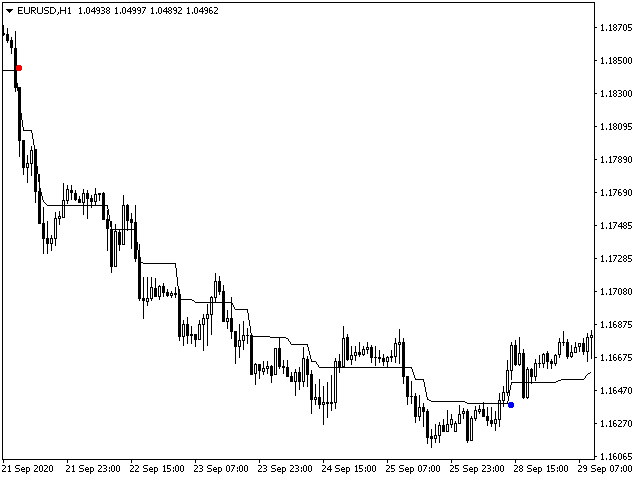
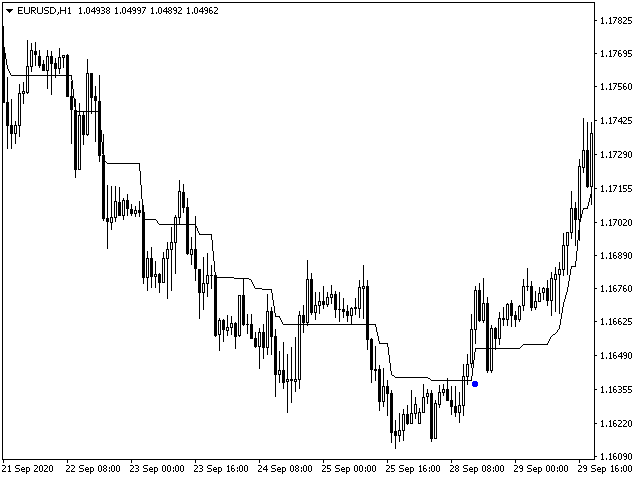
The indicator uses its own market analysis algorithm that recursively goes through bar-level price movement information such as open, close and shadow prices. With this indicator, you can find the most likely trend reversal points. A simple but effective system for determining the forex trend. From the screenshots you can see for yourself the accuracy of this tool. Works on all currency pairs (cryptocurrencies, raw materials, stocks). The alert system (alert, email notifications) will help you monitor several trading instruments at the same time. The recommended principle of work - as soon as a red dot appears, we open a deal on sell. As soon as the blue dot appears, we open a buy trade.

Parameters:
Length - Number of bars for recursive analysis.
OnAlert - Sound notification.
OnEmail - Email notification.
おすすめのプロダクト
VR Cub
Vladimir Pastushak
VR Cub は、質の高いエントリーポイントを獲得するためのインジケーターです。このインジケーターは、数学的計算を容易にし、ポジションへのエントリーポイントの検索を簡素化するために開発されました。このインジケーターが作成されたトレーディング戦略は、長年にわたってその有効性が証明されてきました。取引戦略のシンプルさはその大きな利点であり、初心者のトレーダーでもうまく取引することができます。 VR Cub はポジション開始ポイントとテイクプロフィットとストップロスのターゲットレベルを計算し、効率と使いやすさを大幅に向上させます。取引の簡単なルールを理解するには、以下の戦略を使用した取引のスクリーンショットを見てください。 設定、設定ファイル、デモ版、説明書、問題解決方法は、以下から入手できます。 [ブログ] レビューを読んだり書いたりすることができます。 [リンク] のバージョン [MetaTrader 5] エントリーポイントの計算ルール ポジションをオープンする エントリーポイントを計算するには、VR Cub ツールを最後の高値から最後の安値までストレッチする必要があります。
Black series MT4 - The indicator is designed for trading on binary options with Timeframe M1-M5-M15 Multicurrency (Works on cryptocurrency and currency pairs) The signal appears when the candle opens Up to 90% correct signals There is no signal redrawing at all Can be used with other indicators. Good for scalping! In Settings there is: -Indicator working methods -I Allert Arrow color Red signal down Blue signal up Also watch the video how the indicator works and signals
This is a trend indicator without redrawing Developed instead of the binary options strategy (by the color of the Martingale candlestick) Also works well in forex trading When to open trades (binary options) A signal will appear in the place with a candle signaling the current candle It is recommended to open a deal for one candle of the current timeframe M1 and M5 When a blue dot appears, open a deal up When a red dot appears, open a trade down. How to open trades on Forex. When a signal is rec
Taurus All4 Taurus All4 is a high-performance indicator, it will tell you the strength of the trend, and you will be able to observe the strength of the candle. Our indicator has more than 4 trend confirmations. It is very simple and easy to use. Confirmation Modes Candle Trend Confirmations: When the candle switches to light green the trend is high. When the candle switches to light red the trend is reverting down. When the candle changes to dark red the trend is low. Trendline Trend Conf
The Before indicator predicts the most likely short-term price movement based on complex mathematical calculations. Most of the standard indicators commonly used in trading strategies are based on fairly simple calculations. This does not mean that there were no outstanding mathematicians in the world at the time of their creation. It is just that computers did not yet exist in those days, or their power was not enough for the sequential implementation of complex mathematical operations. Nowa
The indicator for determining key patterns for the BBMA strategy will perfectly complement the Fibo Musang strategy, and can also be used as an independent tool. IMPORTANT! Contact me immediately after purchase to receive the second file! If you have any questions, I will help you deal with the indicator. Designed to save market analysis time; Sends push notifications to the phone when key moments of the strategy have arisen (Extrem A, Csak, cross the BB line with a candle) Advantages Easy to u
GMMA Trade X is an EA based on GMMA. GMMA parameters such as MovingAveragePeriod1-24, MovingAverageMAShift1-24, MovingAverageShift1-24 and CandlestickShift1-24 can be adjusted. GMMA Trade X applies BTN TECHNOLOGY's state-of-the-art intelligent technology to help you create optimal results for your trades. May your dreams come true through GMMA Trade X. Good luck. = == == Inquiries = == == E-Mail:support@btntechfx.com
EA work for EURUSD in timeframe M15. USE stoploss, The account will never break out. Lot risk can set auto or fix: signals see also:  (auto,   Lot_Auto_Equity  = 100 ) https://www.mql5.com/en/signals/1785354 para setting: Lot_mode_select_Fix_or_Auto,when set to Auto,must use " Lot_Auto_Equity " value,example every 100usd , lot=0.01 Lot_Fix,Lot will be still one value,example 0.01 Lot_Auto_Equity,Associated to parameter " Lot_ mode_ select_ Fix_ or_ Auto " . enjoy.
The trend is your friend! This is what this indicator is all about. Follow this famous saying and be safe. Characteristics: Buy/Sell signals fixed on the close of a bar. Works on all symbols and all timeframes. Clear visual market trend laser line, Buy/Sell signal arrows, market strength meter, TP1 & TP2 boxes. Visual signals when to enter, when to exit the market. No repainting. Compatible with Flexible EA for trading automation. (Ask for a free set file optimized to perform 2010-2018) Para
Price reach indicator. It also serves as the perfect term for supports and resistance. I use it in two experts. The basic tool for professional trading. The indicator analyzes the last 500 bar and uses this to determine the levels ( but it doesn't predict the future ) . Personally, I use it on TF H1.  It is very simple. Four lines on chart and that's all. Only two input parameters.  Thousands of indicators. Why this? Is good ? No! Is very good. Please test the indicator prior to purchasing.
Owl smart levels
Sergey Ermolov
4.63 (54)
MT5版  |   FAQ Owl Smart Levels Indicator   は、 Bill Williams   の高度なフラクタル、市場の正しい波構造を構築する Valable ZigZag、エントリの正確なレベルをマークする Fibonacci レベルなどの一般的な市場分析ツールを含む 1 つのインジケーター内の完全な取引システムです。 利益を得るために市場と場所に。 戦略の詳細な説明 インジケータを操作するための指示 顧問-取引助手 プライベートユーザーチャット ->購入後に私に書いて、私はプライベートチャットにあなたを追加し、あなたはそこにすべてのボーナスをダウンロードすることができます 力はシンプルさにあります! Owl Smart Levels   取引システムは非常に使いやすいので、専門家にも、市場を勉強し始めて自分で取引戦略を選択し始めたばかりの人にも適しています。 戦略と指標に秘密の数式や計算方法が隠されているわけではなく、すべての戦略指標は公開されています。 Owl Smart Levels を使用すると、取引を開始するためのシグナルをすばやく確認し、
"The trend is your friend" is one of the best known sayings in investing, because capturing large trendy price movements can be extremely profitable. However, trading with the trend is often easier said than done, because many indicators are based on price reversals not trends. These aren't very effective at identifying trendy periods, or predicting whether trends will continue. We developed the Trendiness Index to help address this problem by indicating the strength and direction of price trend
Was: $249  Now: $99   Market Profile defines a number of day types that can help the trader to determine market behaviour. A key feature is the Value Area, representing the range of price action where 70% of trading took place. Understanding the Value Area can give traders valuable insight into market direction and establish the higher odds trade. It is an excellent addition to any system you may be using. Blahtech Limited presents their Market Profile indicator for the MetaTrader community. Ins
OB Breakout is alert indicator that identifies when a trend or price move is approaching exhaustion(Supply and Demand) and ready to reverse. It alerts you to changes in market movement which typically occur when a reversal or major pullbacks are about to or have happened. The indicator identifies breakouts and price momentum initially, every time a new high or low is formed near a possible Supply or Demand level point. The indicator draws in a rectangle on Supply or Demand Zones.   Once price we
回帰取引を意味する専門的かつ定量的なアプローチを実装する独自の指標。これは、価格が予測可能かつ測定可能な方法で迂回して平均に戻るという事実を利用しており、非定量的な取引戦略を大幅に上回る明確な出入りルールを可能にします。 [ Installation Guide | Update Guide | Troubleshooting | FAQ | All Products ] 明確な取引シグナル 驚くほど簡単に取引できます カスタマイズ可能な色とサイズ パフォーマンス統計を実装します ほとんどの取引戦略を上回ります 適切なSLおよびTPレベルを表示します 電子メール/音声/視覚アラートを実装します 使い方 インディケータは、より高い時間枠からの完全にカスタマイズ可能な移動平均の周りの標準偏差を測定し、トレンドフォローアプローチを使用して正確に取引を見つけます。取引は、現在のチャートの価格アクションに飛び込むことによって見つけられ、価格が選択したより高い時間枠から計算された平均価格帯に戻ったときに閉じられます。それがコード化される方法のために、指標は高ボラティリティと強いトレンドの
This indicator is another variant of the famous powerful indicator Fibonacci-SS https://www.mql5.com/en/market/product/10136 but has different behaviour in placing Pending Order and TP Line. Automatically places Fibonacci retracement lines from the last highest and lowest visible bars on the chart with: An auto Pending Order (Buy/Sell). Taking Profit 1, Taking Profit 2 is pivot point and Taking Profit 3 for extended reward opportunity. The best risk and reward ratio. Simple and powerful indica
Distinctive is a forex trending arrow indicator for identifying potential entry points. I like it, first of all, because it has a simple mechanism of work, adaptation to all time periods and trading tactics. Created on the basis of a regression channel with filters. Plotting the Lawrence indicator signals on a price function chart using a mathematical approach. How it works - when the price breaks out in the overbought / oversold zone (channel levels), a buy or sell signal is generated. Every
【V1.00】MTF NRPA 5 RSI RTDがリリースされました! 非再描画矢印リアルタイム ダッシュボード。 さまざまな RSI インジケーターを使用するのにうんざりしていて、それらが不正確であると感じた場合は、このツールを試してください。 通常、時間枠内の OBOS レベルを決定するために RSI を 1 つだけインストールします。 悪いニュースは、さまざまな時間枠の OBOS レベルと傾向を一度に確認できないことです。 それが私がこの取引ツールを開発した理由です。 それは次のように説明されています。 この取引ツールでは、5 つの RSI を使用します。 はい、5つです! デフォルトでは、RSI 1 と RSI 2 を大きな時間枠、つまり M30 に設定します。 RSI 1 と RSI 2 の交差は、M30 タイムフレームでトレンドの変化があることを意味します。 次に、現在の(小さい)時間枠に RSI 3 と RSI 4 を設定します。たとえば、M5 でチャートを開いたとします。 RSI 3 と RSI 4 の交差点は、現在のタイムフレーム (M5) でトレ
トレンドトレーディング は、タイミングのプルバックとブレイクアウトにより、市場で起こっているトレンドから可能な限り利益を得るように設計された指標です。確立されたトレンドの中で価格が何をしているかを分析することにより、取引の機会を見つけます。 [ インストールガイド | 更新ガイド | トラブルシューティング | よくある質問 | すべての製品 ] 自信を持って効率的に金融市場を取引する むち打ちにならずに確立されたトレンドから利益を得る 収益性の高いプルバック、ブレイクアウト、早期の逆転を認識する この指標は、独自の品質とパフォーマンスを分析します 複数時間枠のダッシュボードを実装します インジケーターは再描画されていません 電子メール/音声/視覚アラートを実装します 確立されたトレンドは多くの取引機会を提供しますが、ほとんどのトレンド指標はそれらを完全に無視しています。インジケーターの解釈はかなり簡単です: (1) トレンドの変化 (2) トレンドの方向への後退 (3) トレンドの方向へのブレイクアウト 赤いダッシュ は下降トレンド中の修正です 青いダッシュ は上昇ト
This unique multi-currency strategy simultaneously determines the strength of trends and market entry points, visualizing this using histograms on the chart. The indicator is optimally adapted for trading on the timeframes М5, М15, М30, Н1. For the convenience of users, the indicator renders the entry point (in the form of an arrow), recommended take profit levels (TP1, TP2 with text labels) and the recommended Stop Loss level. The take profit levels (TP1, TP2) are automatically calculated for
Trend Arrow Super The indicator not repaint or change its data. A professional, yet very easy to use Forex system. The indicator gives accurate BUY\SELL signals. Trend Arrow Super is very easy to use, you just need to attach it to the chart and follow simple trading recommendations. Buy signal: Arrow + Histogram in green color, enter immediately on the market to buy. Sell signal: Arrow + Histogram of red color, enter immediately on the market to sell. Please email me after your purchase!
Forex Gump Booster Scalping is a forex signal indicator. Shows on the Metatrader4 chart signals when to open trades to buy and sell. Also sends signals to the phone and email. EA works on all currency pairs and timeframes. The default parameters are set to EURUSD D1. But you can customize to any currency pair. The indicator will help you with this. You select the parameters in the settings, and the indicator displays the predicted profit / loss for the last 1000 bars. If the projected profit sui
True SnD
Indra Lukmana
5 (1)
This Supply & Demand indicator uses a unique price action detection to calculate and measures the supply & demand area. The indicator will ensure the area are fresh and have a significant low risk zone. Our Supply Demand indicator delivers functionality previously unavailable on any trading platform. Trading idea You may set pending orders along the supply & demand area. You may enter a trade directly upon price hit the specific area (after a rejection confirmed). Input parameters Signal - S
Fourteen plus nine What is it for? Applying Tom DeMark’s TD Sequential serves the purpose of identifying a price point where an uptrend or a downtrend exhausts itself and reverses. . What are the main components of TD Sequential? TD Sequential has two parts – TD Setup and TD Countdown. The first phase of TD Sequential starts with a TD Setup and is completed with a 9 count. When the 9 count is completed, it is at that point, a price pause, price pullback, or reversal is likely. It is also at tha
まず第一に、この取引ツールはノンリペイント、ノンリドロー、ノンラグの指標であり、プロの取引に理想的ですことを強調する価値があります。 オンラインコース、ユーザーマニュアル、デモ。 スマートプライスアクションコンセプトインジケーターは、新米から経験豊富なトレーダーまで、非常 に強力なツールです。Inner Circle Trader AnalysisやSmart Money Concepts Trading Strategiesなど、20以上の有用な指標を1つに組み合わせています。このインジケーターはスマートマネーコンセプトに焦点を当て、大手機関の取引方法を提供し、彼らの動きを予測するのに役立ちます。 特に、流動性分析に優れており、機関がどのように取引しているかを理解しやすくしています。市場のトレンドを予測し、価格の動きを慎重に分析するのに優れています。機関の戦略とトレードを合わせることで、市場の動向についてより正確な予測ができます。このインジケーターは多目的であり、市場構造を分析し、重要な注文ブロックを特定し、さまざまなパターンを認識するのに優れています。 このインジケー
GG TrendBar Indicator - Your Multitimeframe ADX Trading Solution Experience the power of multi-timeframe trading with the "GG TrendBar Indicator." This versatile tool, built upon the ADX indicator, offers precise insights by considering multiple timeframes, ensuring you make well-informed trading decisions. Basic Details : Indicator Type : GG TrendBar Indicator (Multi-Timeframe ADX) Key Metrics : Real-time ADX analysis across multiple timeframes. Customization : Enable or disable specific timefr
v. 1.0 This indicator can show with maximum accuracy up to 1 bar the presence of a Maximum/minimum on the chart, regardless of the timeframe. It has a flexible configuration. You can use either one value on all TF, or you can use your own value on each TF individually. This indicator is already being improved and those who purchase it receive all updates for free. Next, it is planned to display an indication of the strength of the pivot point at each extremum (in % or in color drawing). It
This index can be traced back to historical transactions, and can clearly see the trading location, trading type, profit and loss situation, as well as statistical information. Showlabel is used to display statistics. Summy_from is the start time of order statistics. This parameter is based on the opening time of the order. Backtracking can help us to correct the wrong trading habits, which is very important for beginners to learn manual transactions. This index is suitable for each time
PipFinite Trend PRO
Karlo Wilson Vendiola
4.9 (2775)
Breakthrough Solution For Trend Trading And Filtering With All Important Features Built Inside One Tool! Trend PRO's smart algorithm detects the trend, filters out market noise and gives entry signals with exit levels. The new features with enhanced rules for statistical calculation improved the overall performance of this indicator. Important Information Revealed Maximize the potential of Trend Pro, please visit www.mql5.com/en/blogs/post/713938 The Powerful Expert Advisor Version Automa
このプロダクトを購入した人は以下も購入しています
現在26%オフ 初心者やエキスパートトレーダーに最適なソリューション! このインジケーターは、独自の機能と新しい計算式を取り入れた、ユニークで高品質、かつ手頃な価格のトレーディングツールです。たった1枚のチャートで28の為替ペアの通貨強度を読み取ることができます。新しいトレンドやスキャルピングチャンスの引き金となるポイントを正確に特定することができるので、あなたのトレードがどのように改善されるか想像してみてください。 ユーザーマニュアルはこちら  https://www.mql5.com/en/blogs/post/697384 これが最初の1本、オリジナルだ! 価値のないクローンを買わないでください。 特別な サブウィンドウの矢印で強い通貨の勢いを表示 GAPがあなたのトレードを導く! 基準通貨や気配値が売られすぎ・買われすぎのゾーン(外相フィボナッチレベル)にあるとき、個別チャートのメインウィンドウに警告表示。 通貨がレンジの外側から反落した場合、プルバック/リバーサルのアラート。 クロスパターンの特別なアラート 複数の時間枠を選択可能で、トレンドを素早く
74% discount for the next 10 buyers (original price $605): 1 left Get a 50% bonus by buying (or even renting) any of our products. After buying (or renting), send a message for more information. 3 Indicators in 1 indicator Strategy based on price action Made specifically for the best forex currency pairs Can be used in the best time frame of the market at a very reasonable price This indicator is basically 3 different indicatos . But we have combined these 3 indicators in 1 indicator so th
まず第一に、この取引インジケーターは再描画されず、再描画されず、遅延しないことを強調する価値があります。これにより、手動取引とロボット取引の両方に理想的なものになります。 ユーザーマニュアル:設定、入力、戦略。 アトミックアナリストは、価格の強さとモメンタムを利用して市場でより良いエッジを見つけるためのPA価格アクションインジケーターです。ノイズや誤ったシグナルを除去し、取引ポテンシャルを高めるための高度なフィルターを備えています。複雑なインジケーターの複数のレイヤーを使用して、アトミックアナリストはチャートをスキャンし、複雑な数学的計算をシンプルなシグナルと色に変換します。これにより、どのような初心者トレーダーでも理解して使用し、一貫した取引の決定を行うことができます。 「アトミックアナリスト」は、新規および経験豊富なトレーダー向けにカスタマイズされた包括的な取引ソリューションです。プレミアムインジケーターとトップノッチの機能を1つの取引戦略に組み合わせ、すべてのタイプのトレーダーにとって汎用性のある選択肢にします。 デイリートレーディングとスキャルピング戦略:高
A key element in trading is zones or levels from which decisions to buy or sell a trading instrument are made. Despite attempts by major players to conceal their presence in the market, they inevitably leave traces. Our task was to learn how to identify these traces and interpret them correctly. Reversal First Impulse levels (RFI)   -  Version MT5                INSTRUCTIONS                 RUS                 ENG                                       R ecommended to use with an indicator   -  
TPSpro TRENDPRO  - is a trend indicator that automatically analyzes the market and provides information about the trend and each of its changes, as well as giving signals for entering trades without redrawing! The indicator uses each candle, analyzing them separately. referring to different impulses - up or down impulse. Exact entry points into transactions for currencies, crypto, metals, stocks, indices!  -  Version MT5               DETAILED DESCRIPTION        /       TRADING SETUPS           
ご紹介   クォンタム トレンド スナイパー インジケーターは 、トレンド反転を特定して取引する方法を変革する画期的な MQL5 インジケーターです。 13年以上の取引経験を持つ経験豊富なトレーダーのチームによって開発されました。     クォンタムトレンドスナイパーインジケーター   は、非常に高い精度でトレンドの反転を識別する革新的な方法で、あなたのトレーディングの旅を新たな高みに押し上げるように設計されています。 ***Quantum Trend Sniper Indicatorを購入すると、Quantum Breakout Indicatorを無料で入手できます!*** クォンタム ブレイクアウト インジケーターは、トレンドの反転を特定するとアラートを発し、矢印を示し、3 つのテイクプロフィットレベルを提案します。 初心者トレーダーにもプロのトレーダーにも適しています。 量子EAチャネル:       ここをクリック MT5のバージョン:       ここをクリック 推奨事項: 期間: すべての時間枠。最良の結果を得るには、
ご紹介     Quantum Breakout PRO は 、ブレイクアウト ゾーンの取引方法を変革する画期的な MQL5 インジケーターです。 13年以上の取引経験を持つ経験豊富なトレーダーのチームによって開発された Quantum Breakout PROは 、革新的でダイナミックなブレイクアウトゾーン戦略により、あなたの取引の旅を新たな高みに押し上げるように設計されています。 クォンタム ブレイクアウト インジケーターは、5 つの利益ターゲット ゾーンを備えたブレイクアウト ゾーン上のシグナル矢印と、ブレイクアウト ボックスに基づいたストップロスの提案を提供します。 初心者トレーダーにもプロのトレーダーにも適しています。 量子EAチャネル:       ここをクリック MT5バージョン:   ここをクリック 重要!購入後、インストールマニュアルを受け取るためにプライベートメッセージを送ってください。 推奨事項: 時間枠: M15 通貨ペア: GBPJPY、EURJPY、USDJPY、NZDUSD、XAUUSD アカウントの種類: ECN、Raw、また
カスタムMT4インジケーターで外国為替取引を成功させるための秘密を発見してください! 外国為替市場で成功を達成し、リスクを最小限に抑えながら一貫して利益を得る方法を疑問に思ったことはありますか? これがあなたが探している答えです! 取引へのアプローチに革命をもたらす独自のMT4インジケーターを導入できるようにします。 ユニークな汎用性 私たちのインジケータは、RenkoとRangeBarのろうそくのフォーメーションを好むユーザー向けに特別に設計されています。 これらのチャートタイプは多くの経験豊富なトレーダーに好まれていることを理解しています。そのため、私たちのインジケーターはそれらとシームレスに統合され、比類のない市場分析を提供します。 クリアトレンドシグナル 複雑な分析を忘れてください! 私たちのインジケーターは、鮮やかな色と明確なドット構造を利用して、市場の動向を明確に示しています。 赤と青の点は、価格の動きの方向性について疑いの余地がなく、取引の迅速な意思決定を可能にします。 HH/HL HL/LL戦略とのアライメント HH/HLおよびHL/LL構
An exclusive indicator that utilizes an innovative algorithm to swiftly and accurately determine the market trend. The indicator automatically calculates opening, closing, and profit levels, providing detailed trading statistics. With these features, you can choose the most appropriate trading instrument for the current market conditions. Additionally, you can easily integrate your own arrow indicators into Scalper Inside Pro to quickly evaluate their statistics and profitability. Scalper Inside
FX Volume
Daniel Stein
4.6 (35)
mql5と Telegramの モーニング・ブリーフィングで、詳細とスクリーンショットを含む毎日のマーケット・アップデートをご覧 ください! FX Volumeは、ブローカーの視点から市場のセンチメントをリアルに洞察する、最初で唯一の出来高インジケーターです。 ブローカーのような機関投資家が外国為替市場でどのようなポジションをとっているか、COTレポートよりもはるかに速く、素晴らしい洞察を提供します。 この情報をチャート上で直接見ることは、あなたの取引にとって真のゲームチェンジャーであり、画期的なソリューションです。 以下のようなユニークなマーケットデータ洞察から利益を得てください。 比率は 、通貨のロングポジションとショートポジションの比率をパーセントで表示します。 比率の変化は 、選択した期間内のロング比率とその変化率を表示します。 Volumes Totalは 、通貨の取引量(ロングとショート)の合計をロット単位で表示します。 Volumes Long :全通貨のロングポジションの取引量を表示します。 Volumes(ショート )は、全通貨のショートポジションの取引量を表示
Advanced Supply Demand
Bernhard Schweigert
4.92 (310)
現在33%オフ 初心者にもエキスパートトレーダーにも最適なソリューション このインジケーターは独自の機能と新しい公式を多数内蔵しており、ユニークで高品質かつ手頃な取引ツールです。このアップデートでは、2つの時間枠ゾーンを表示できるようになります。より長いTFだけでなく、チャートTFとより長いTF(ネストゾーンを表示)の両方を表示できます。すべてのSupply Demandトレーダーの皆さんのお気に召すはずです。:) 重要情報の公開 Advanced Supply Demandの可能性を最大化するには、 https://www.mql5.com/ja/blogs/post/720245 にアクセスしてください。   エントリーまたはターゲットの正確なトリガーポイントを正確に特定できれば取引がどのように改善されるか想像してみてください。新しい基盤となるアルゴリズムに基づいて構築されているため、買い手と売り手の間の潜在的な不均衡をさらに簡単に特定できます。これは、最も強い需要と供給のゾーンと、過去のパフォーマンス(古いゾーンを表示)がグラフィカルに表現されるためです。これらの機能は、最適
mql5と Telegramの モーニング・ブリーフィングで、詳細とスクリーンショットを含む毎日のマーケット・アップデートをご覧 ください! FX Power MT4 NGは 、長年の人気を誇る通貨強度計FX Powerの次世代モデルです。 この次世代ストレングスメーターは何を提供するのでしょうか?初代FXパワーの魅力すべて プラス GOLD/XAUの強さ分析 より正確な計算結果 個別に設定可能な分析期間 カスタマイズ可能な計算上限値により、さらに優れたパフォーマンスを実現 もっと見たい人のための特別なマルチインスタンス設定 すべてのチャートでお好みの色を無限に設定可能 数え切れないほどの通知オプションにより、重要なことを見逃すことはありません。 Windows 11とmacOSのスタイルで角を丸くした新しいデザイン 魔法のように動くインジケーターパネル FXパワーの主な機能 すべての主要通貨の強さの完全な履歴 すべての時間枠における通貨の強さの履歴 すべてのブローカーとチャートで同一の計算結果 100%信頼できるリアルタイム計算 -> リペイントなし ドロップダウン・リストから
このインディケータは、当社の2つの製品 Advanced Currency IMPULSE with ALERT  +   Currency Strength Exotics . のスーパーコンビネーションです。 このインジケーターは全ての時間枠で作動し、8つの主要通貨と1つのシンボルの強弱のインパルスをグラフで表示します。 このインジケータは、金、エキゾチックペア、商品、インデックス、先物など、あらゆるシンボルの通貨強度の加速度を表示することに特化されています。金、銀、原油、DAX、US30、MXN、TRY、CNHなどの通貨強度の加速度(インパルスまたは速度)を表示するために、任意のシンボルを9行目に追加できる、この種の最初のものです。 新しいアルゴリズムに基づいて構築され、潜在的な取引の特定と確認がさらに容易になりました。これは、通貨の強さや弱さが加速しているかどうかをグラフィカルに表示し、その加速の速度を測定するためです。加速すると物事は明らかに速く進みますが、これはFX市場でも同じです。つまり、反対方向に加速している通貨をペアリングすれば、潜在的に利益を生む取
現在20%OFF! 初心者やエキスパートトレーダーのためのベストソリューション! このダッシュボードソフトウェアは、28の通貨ペアで動作しています。それは私達の主要な指標(高度な通貨の強さ28と高度な通貨インパルス)の2に基づいています。それは全体の外国為替市場の大きい概観を与えます。それは、すべての(9)時間枠で28の外国為替ペアのための高度な通貨の強さの値、通貨の動きの速度と信号を示しています。チャート上で1つのインディケータを使用して市場全体を観察し、トレンドやスキャルピングの機会をピンポイントで見つけることができたら、あなたのトレードがどのように改善されるか想像してみてください。 このインディケータには、強い通貨と弱い通貨の識別、潜在的な取引の識別と確認がより簡単になるような機能が搭載されています。このインディケータは、通貨の強さや弱さが増加しているか減少しているか、また、すべての時間枠でどのように機能しているかをグラフィカルに表示します。 新機能として、現在の市場環境の変化に適応するダイナミックなマーケットフィボナッチレベルが追加され、すでに当社のAdvan
TrendMaestro
Stefano Frisetti
5 (2)
note: this indicator is for METATRADER4, if you want the version for METATRADER5 this is the link:  https://www.mql5.com/it/market/product/108106 TRENDMAESTRO ver 2.4 TRENDMAESTRO recognizes a new TREND in the bud, he never makes mistakes. The certainty of identifying a new TREND is priceless. DESCRIPTION TRENDMAESTRO identifies a new TREND in the bud, this indicator examines the volatility, volumes and momentum to identify the moment in which there is an explosion of one or more of these data a
現在31%オフ! 初心者やエキスパートトレーダーに最適なソリューション! このインジケータは、独自の機能と秘密の数式を組み込んだ、ユニークで高品質かつ手頃な価格のトレーディングツールです。たった1枚のチャートで28の通貨ペアのアラートを表示します。新しいトレンドやスキャルピングチャンスの引き金となるポイントを正確に把握することができるので、あなたのトレードがどのように改善されるか想像してみてください! 新しい基本的なアルゴリズムに基づいて構築されているため、潜在的な取引の特定と確認がより簡単になります。これは、通貨の強さや弱さが加速しているかどうかをグラフィカルに表示し、その加速のスピードを測定するためです。加速すると物事は明らかに速く進みますが、これはFX市場でも同じです。つまり、反対方向に加速している通貨をペアにすれば、利益を生む可能性のある取引を特定することができるのです。 通貨の勢いを示す縦の線と矢印は、あなたの取引の指針となるでしょう。 ダイナミックマーケットフィボナッチ23レベルはアラートトリガーとして使用され、市場の動きに適応します。もしインパルスが黄色
An extremely convenient indicator that truly makes the process of making money on the exchange easy. It is based on the scientifically rigorous theory of the market developed by the author, the beginning of which is presented here .                The full algorithm of this indicator operation is presented in the article .               The indicator calculates the most probable price movement trajectory and displays it on the chart. Based on the predicted price movement trajectory
もちろんです。以下は、提供いただいたテキストの日本語への翻訳です: MT4用の天文学指標をご紹介します:究極の天体トレーディングコンパニオン トレーディング体験を天空の高みに高める準備はできていますか?私たちの革命的なMT4用の天文学指標をご紹介します。この革新的なツールは、複雑なアルゴリズムの力を借りて、類まれなる天文学的洞察と精密な計算を提供します。 あなたの指先で宇宙の情報を: 宝のような天文学的データが明らかになる包括的なパネルをご覧ください。惑星の地理的/太陽中心座標、太陽と地球の距離、星の大きさ、伸び、星座、黄道座標および赤道座標、さらには水平座標まで、それぞれが綿密に計算され美しく表示されています。指標によって生成される垂直線は時間値に対応し、トレーディングの旅に宇宙の視点を提供します。 惑星のラインと関係: グラフを飾る惑星のラインの魔法を体験し、スケールと角度をカスタマイズできます。直感的なコントロールパネルを介して各惑星のラインの表示を簡単に切り替えることができます。指定された時刻範囲内での合会、六分会、四分会、三分会、対会、逆行の指標で天体の関係の芸術を発見してく
M W Pattern Pro
Nesimeye Oswald
4.14 (7)
M & W Pattern Pro is an advanced scanner for M and W patters , it uses extra filters to ensure scanned patterns are profitable. The indicator can be used with all symbols and time frames. The indicator is a non repaint indicator with accurate statistics calculations. To use , simply scan the most profitable pair using the statistics dashboard accuracy , then enter trades on signal arrow and exit at the TP and SL levels. STATISTICS : Accuracy 1 : This is the percentage of the times price hit
ON Trade Waves Patterns Harmonic Elliot Wolfeをご紹介します。これは手動および自動の方法を使用して市場のさまざまなパターンを検出するために設計された高度なインジケーターです。以下はその動作方法です: ハーモニックパターン: このインジケーターは、チャートに表示されるハーモニックパターンを識別できます。これらのパターンは、Scott Carneyの「Harmonic Trading vol 1および2」で説明されているように、ハーモニックトレーディング理論を実践するトレーダーにとって重要です。手動で描画するか、自動検出に頼るかにかかわらず、ON Trade Waves Patternsがお手伝いします。 コントロールパネル: このインジケーターはユーザーフレンドリーなコントロールパネルを備えています。チャートと時間枠の設定を保存し、異なる構成間をスムーズに切り替えることができます。チャートスペースを最大限に活用するために最小化することもできます。他の分析ツールで作業することを好む場合、閉じるボタンをクリックするだけで、すべてのインジケーターデ
Advanced version of CyberZingFx Volume Plus, the ultimate MT4 indicator for traders seeking highly accurate buy and sell signals. With an additional strategy and price action dot signals that enhances its effectiveness, this indicator offers a superior trading experience for professionals and beginners alike. The CyberZingFx Volume Plus Advanced version combines the power of volume analysis and historical price data with an additional strategy, resulting in even more precise and reliable signals
Automated Trendlines
Georgios Kalomoiropoulos
5 (16)
トレンドラインは、外国為替取引におけるテクニカル分析の最も重要なツールです。残念ながら、ほとんどのトレーダーはそれらを正しく描画していません。自動トレンドラインインジケーターは、市場のトレンドの動きを視覚化するのに役立つ本格的なトレーダー向けのプロフェッショナルツールです。 トレンドラインには、強気トレンドラインと弱気トレンドラインの2種類があります。 上昇トレンドでは、外国為替トレンドラインは価格変動の最低スイングポイントを介して描画されます。 少なくとも2つの「最低安値」を接続すると、トレンドラインが作成されます。 下降トレンドでは、トレンドラインは価格変動の最も高いスイングポイントを介して描画されます。 少なくとも2つの「最高値」を接続すると、トレンドラインが作成されます。 トレンドラインが壊れたとき? 弱気のろうそくが強気のトレンドラインの下で閉じ、ろうそくの高さがトレンドラインの上にあるとき、強気のトレンドラインは壊れます。 強気のろうそくが弱気のトレンドラインの上で閉じ、ろうそくの安値がトレンドラインの下にあるとき、弱気のトレ
Thise indicator is up down v6  comes with tradingwiev pinescript. purchased people, after installed on terminal ,contact me on mql5  to get BONUS  TradingView pinescript. up-down indicator is no repaint and works all pairs and lower than weekly time frames charts. it is suitable also 1 m charts for all pairs. and hold long way to signal. dont gives too many signals. when red histogram cross trigger line that is up signal.and price probably will down when blue histogram cross trigger line that
This indicator is very simple. It tracks the trend and leads it until it changes. You can also set or trail a stop using this indicator. The indicator is equipped with the ability to track older trends on lower charts. Optimal use is achieved by using this indicator together on the current and senior charts. Write after purchase to receive personal recommendations.
Price Action Entry Alerts
Stephen Sanjeeve Sahayam
5 (3)
このインジケーターは、売買圧力についてすべてのバーをスクリーニングし、最大量の 4 種類のローソク足パターンを特定します。次に、これらのローソク足はいくつかの線形フィルターを使用してフィルター処理され、買いまたは売りのシグナルが表示されます。シグナルは、より高い時間枠の方向と組み合わせて、取引量が多い時間帯に取引される場合に最も効果的に機能します。すべてのフィルターはカスタマイズ可能で、独立して動作します。ボタンをクリックするだけで単一方向の信号を表示できます。 このインジケーターには、意思決定プロセスに役立つ最も重要な価格アクションとスマート マネーの概念も組み込まれています。 シグナルとトレードに関する教育をすべて 1 つのツールにまとめました。 特徴: 信号は再描画されません。 飲み込むキャンドル、拒否キャンドル、拡張範囲キャンドル、ピンバーを識別します。 有効なシグナルごとに複数のエントリー、ストップロス、複数のテイクプロフィットレベルを表示します。 大容量セッションでフィルタリングします。 サポート/レジスタンスレベルとローソク足の構造でフィルターします。 MACD ヒ
今、147ドル(いくつかの更新後に499ドルに増加します) - 無制限のアカウント(PCSまたはMac) RelicusRoad ユーザー マニュアル + トレーニング ビデオ + プライベート Discord グループへのアクセス + VIP ステータス 市場の新しい見方 RelicusRoad は、外国為替、先物、暗号通貨、株式、および指数の世界で最も強力な取引インジケーターであり、トレーダーに収益を維持するために必要なすべての情報とツールを提供します。初心者から上級者まで、すべてのトレーダーが成功するためのテクニカル分析と取引計画を提供します。これは、将来の市場を予測するのに十分な情報を提供する重要な取引指標です。意味をなさないチャート上のいくつかの異なる指標ではなく、完全な解決策を信じています.これは、信号、矢印 + 価格アクション情報を表示するオールインワンのインジケーターで、他に類を見ない非常に正確です。 強力な AI に基づいて、RelicusRoad は不足している情報とツールを提供して、あなたを教育し、トレーディングのプロ、成功したトレーダーにします。
OVERVIEW A Lorentzian Distance Classifier (LDC) is a Machine Learning classification algorithm capable of categorizing historical data from a multi-dimensional feature space. This indicator demonstrates how Lorentzian Classification can also be used to predict the direction of future price movements when used as the distance metric for a novel implementation of an Approximate Nearest Neighbors (ANN) algorithm. This indicator provide signal as buffer, so very easy for create EA from this in
Introduction Harmonic Patterns are best used to predict potential turning point. Traditionally, Harmonic Pattern was identified manually connecting peaks and troughs points in the chart. Manual harmonic pattern detection is painfully tedious and not suitable for everyone. You are often exposed under subjective pattern identification with manual pattern detection. To avoid these limitations, Harmonic Pattern Plus was designed to automate your harmonic pattern detection process. The functionality
How to use Pair Trading Station Pair Trading Station is recommended for H1 time frame and you can use it for any currency pairs. To generate buy and sell signal, follow few steps below to apply Pair Trading Station to your MetaTrader terminal. When you load Pair Trading Station on your chart, Pair Trading station will assess available historical data in your MetaTrader platforms for each currency pair. On your chart, the amount of historical data available will be displayed for each currency pai
Orders Indicator
Andrey Khatimlianskii
4.43 (7)
i-Orders is a simple indicator to monitor your own trade/analyze others' trades. I use it for a long time and do not imagine a chart without these arrows, lines and trade result numbers. The features allow you to: change the size and location of the control buttons ( Control buttons size , Control buttons corner ), disable display of opened and closed positions ( Show OPENED , Show CLOSED , Show PENDING ), change colors of arrows and lines for profitable and loss-making buy and sell positions se
作者のその他のプロダクト
An indicator from the zigzag family with levels. First of all, I will point out arguments in favor of the advisability of using a level indicator. They give the trader the following benefits: Alternative points of view - the level indicator helps to look at the levels from the side, compare them with several automatic systems, identify errors; Saving time - reducing the cost of effort for self-building lines; Exact mathematical calculation - quick calculation of levels, ratios of indicato
The indicator calculates the saturation levels of the price chart. A signal to exit the resale area is a buy signal. A signal to exit the overbought area is a sell signal. Usually, you need to set relative values ​​for the overbought and oversold levels of Bottom and Top - for this indicator. Most often, a good trend is visible on the price chart visually. But an experienced trader must clearly understand the current balance of power in the market before entering. And the indicator will help
This indicator can track the steady price movement in a certain direction. In this case, the movement itself can be downward, upward or lateral, when the market movement does not have a pronounced focus. The indicator works on the basis of two moving average as well as an oscillator. Using the signal search algorithm, the indicator generates signals in the form of arrows. Benefits. Allows you to determine the current trend. You can quickly enough understand which particular trend is currently
Dolphin Bands indicator works equally well on any timeframes. For medium-duration trends, it is recommended to use the standard setting. To study long-term trends, it is recommended to use an indicator value greater than the standard. To analyze short-term trends, it is better to use a lower indicator value. Most often, an exponential method is used to calculate the indicator, but other varieties can also be used. Dolphin Bands is a collection of lines. The two center lines of the indicator a
Martingals indicator works on all currency pairs and on all timeframes. The arrows indicate the optimal entry points for future Martingale averaging, even with a zero exponent. The indicator shows a signal to close the series only if all previous signals can be closed in profit. After closing a series in profit, you need to immediately open an order in the direction of the signal. Thus, the close signal is at the same time the reverse opening point to the other side of the new order. The probabi
Levels Market is one of the simplest, but no less effective tools from this. Pivot points can be built from these levels, levels are constructed as statistical significance at a given point in time. Trading by levels is a classic in the work of a trader. You can use them as a ready-made trading strategy or as an additional filter in your trading system. In the settings you can specify the offset for building levels. Interpretation of levels: Lines 8/8 and 0/8 (Final Resistance). These lines a
Trend New Trend Indicator, shows the signals for entry. Displays both entry points and the trend itself. Shows statistically calculated moments for entering the market with arrows. When using the indicator, it is possible to optimally distribute the risk factor. Settings: Uses all one parameter for settings. Selecting a parameter, it is necessary to visually resemble it so that the appropriate graph has a projection of extremes. Options: Length - the number of bars for calculating the ind
Condors TMA  ( Triangular Moving Average ) is a channel indicator without redrawing, built on the basis of moving averages. The key difference between the Condor TMA indicator and other channel indicators (for example, from the same Bollinger indicator) is that Condor TMA takes into account not simple moving averages, but twice smoothed ones, which allows one to more clearly determine the market movement, and on the other hand makes the indicator less sensitive.
Cancer indicator is great for trend trading! An intelligent indicator algorithm with high probability shows the points of potential market reversal. If you are trading in a trend, then a trading strategy built on the basis of this indicator is perfect for you. The indicator filters out market noise, almost everything and all the necessary functions for working with a thread are built into one tool. It works on all currency pairs and on all timeframes, indicator setting - according to your desire
A very simple and convenient trend indicator based on price divergence. He showed himself well in scalping. Help in finding entry points for analysis. It can be used as a filter in trade. It has two parameters: Period and Level. The Level parameter helps to filter out excess signals. For example, for EURUSD, the Level parameter may be 0.0001. The indicator can work both for entry points and as a filter. The indicator reflects information in a visual form. We must not forget that the approach to
Calculated trend indicator, can be used with an optimal risk to profit ratio, shows successful signals. Uses two options for settings. Shows favorable moments for entering the market with arrows. The probability of a successful trend is not very bad! The indicator can be used both for pipsing on small periods, and for long-term trading. The indicator does not redraw and does not lag. It works on all currency pairs and on all timeframes.
XStrain
Vitalii Zakharuk
The XStrain expert system works on all types of accounts. It works both in 4 and 5-digit quotes. Spread and requotes are not critical, any broker is suitable. To optimize the expert system, one year is recommended for the period H1 or H4. Optimization can be carried out at opening prices, the results differ little from testing on real ticks, since the bot works at opening prices. It is enough to optimize once a month! To get better results, it is recommended to work on several different pairs
An expert of a new type Formulas has been created - it works using sharp tick movements. The uniqueness of the expert is that it can be launched on any hour period, any currency pair, and on the server of any broker. What makes the expert attractive enough to use for trading. It is recommended to work on liquid forex pairs with a low spread. The lower the commission and spread, the greater the profit. You can start using it with $ 100 and a lot of 0.01. A small initial deposit also contributes
The Trend Distinctive indicator smoothes price fluctuations during signal formation by averaging the data. This gives the trader the opportunity to visually determine what trend will be present at a particular time interval. This is an auxiliary tool for technical analysis, which helps to determine the exact direction of the trend: either an upward or downward movement of the price of a trading instrument. Although the indicator is a little late, it still generates the most reliable signals t
Red Bot
Vitalii Zakharuk
The mechanism of work of the Red Bot Expert Advisor is designed so that before opening a transaction, they undergo instant implicit filtering, which, if there are competent and practical settings, allows the buyer to level the number of unprofitable and unproductive transactions. The adviser has a large number of internal regulators, software installations and special codes that help to safely and efficiently trade. This is a fully automated Expert Advisor, built on the scalping strategy, wor
Introduced expert system   Stable Ex works with the EURUSD currency pair and only with it. This system implemented the principle of five orders - that is, a maximum of five orders can be placed in one direction, after which the total position of the series must be closed by stops, either real or virtual. The trading system is designed to work separately with a series of buy orders and separately with a series of sell orders. which makes the trading system versatile enough. The expert passes all
The presented expert system works with the GBPUSD currency pair and only with it. This system implemented the principle of seven orders - that is, a maximum of seven orders can be made in one direction, after which the total position of the series should be closed by stops, either real or virtual. The trading system is designed to work separately with a series of buy orders and separately with a series of sell orders. which makes the trading system versatile enough. The expert passes all types
Transition indicator can track a steady price movement in a certain direction. In this case, the movement itself can be downward, upward or sideways, when the market movement does not have a pronounced focus. The indicator works on the basis of two moving average as well as an oscillator. Using the signal search algorithm, the indicator generates signals in the form of arrows. Trading based on trend indicators is the simplest and often the most effective. If you correctly determine the beginn
Global Trend Indicator, shows the signals for entry. Displays both entry points and the trend itself. Shows statistically calculated moments for entering the market with arrows. When using the indicator, the risk factor can be optimally distributed. Settings: Uses all one parameter for settings. Choosing a parameter, it is necessary to visually resemble it so that the appropriate graph has a projection of extremes. Parameters: Length - the number of bars for calculating the indicator.
Trend DI is an auxiliary tool for technical analysis that helps determine the exact direction of a trend: either an upward or downward movement of the price of a trading instrument. Although the Trend DI indicator is a bit late, it still generates the most reliable signals that a trader can safely navigate. The Trend DI indicator smooths price fluctuations during signal formation by averaging data. This gives the trader the opportunity to visually determine which trend will be present in a pa
The Trend ZVD Trend Indicator is important for identifying trends in financial markets. However, this indicator works equally well during consolidation periods. The Trend ZVD trend indicator indicates the direction in which the asset of your choice can move. The Trend ZVD trend indicator copes with the main task of trading: to find the entry point to the market at the time the trend is created and the exit point at the time it is completed. A trend in trade is the steady movement of quotes in
The Progress Scalp strategy is based on tick trading principles. At its core, this strategy is fenders, that is, the trader receives signals for opening positions during pullbacks from the main movement. A distinctive feature of this strategy is that transactions are concluded only during periods of strong tick movements in the forex market. The Progress Scalp strategy was developed for trading with different currency pairs. You need to choose a currency pair with the lowest spreads and virtual
Long
Vitalii Zakharuk
The Long expert system works with the EURUSD currency pair and only with it. The trading system is designed to work separately with a series of buy orders and separately with a series of sell orders. which makes the trading system versatile enough. The expert passes all types of testing throughout the history for the specified currency pair. Also, the expert system is tested with various delay values, it works in fully automatic mode! No settings are needed, use only the default settings. T
The indicator is simple and clear, making the work of the trader as easy as possible and giving clear signals to enter the market. This indicator has two settings for the period. Which makes it more flexible. And at the same time, many false signals do not appear. The larger the period, the smoother the indicator itself will be. It can be used both independently and together with other indicators of technical analysis (including with oscillators), as well as with another same indicator (wit
Индикатор отображает регнессионный канал с сопровождением каналов фактически создавая уровни поддержки и сопротивления. Уровни поддержки и сопротивления являются одним из важнейших элементов технического анализа. С этим утверждением согласится любой трейдер. Уровни в трейдинге используются непосредственно, открывая и закрывая ордера у границ диапазона, очерченного ими. Также уровни применяют баланс спроса и предложения в своих торговых стратегиях на различных временных интервалах. Визуально
An expert of a new type Anniversary - works using sharp tick movements, the algorithm that was created earlier is significantly improved. The uniqueness of the expert is that it can be launched on any hour period, any currency pair, and on the server of any broker. What makes the expert attractive enough to use for trading. It is recommended to work on liquid forex pairs with a low spread. The lower the commission and spread, the greater the profit. You can start using it with $ 100 and a lot o
The Trends Signal indicator displays the direction of the trend with arrows, works in a simple and clear way. It uses a combination of reliable and simple indicators to analyze prices. The signals of the Trends Signal indicator can be interpreted as follows: buy when the bars are colored blue, and sell when they are red. An effective indicator with a wide range of three parameters for trading. Parameters: Length - The number of bars to calculate. LevelUP, LevelDN - Levels for determining over
The Open Trend indicator calculates the saturation levels of the price chart. Most often, a good trend is visible on a price chart visually. But an experienced trader should clearly understand the current balance of power in the market before entering. A signal to exit the oversold area is a buy signal. A signal to exit the overbought area is a sell signal. Usually, you need to set the relative values ​​for the overbought and oversold levels Bottom and Top for this indicator. The Open Trend
Sharp
Vitalii Zakharuk
Sharp expert system works with a deposit of $ 100! The classic method of scalping. It is also worth noting that with the allowable level of the spread, the bot goes through any historical period on any currency pair. The key for the Sharp bot is the spread, it works with default settings, it is possible to work with a spread of up to 10. If the spread is more than 10, then you need to select other settings. Testing should be performed with a spread of up to 10 on all ticks. There is no point
Are you tired of the constant ups and downs? It is not worth becoming a victim of unstable market movements, it is time to somehow get rid of it! Already now, you can use Business Trend solutions to balance the analysis of price movements and get a clearer picture of price behavior. Business Trend is a trend indicator for the MetaTrader 4 trading platform. This indicator allows you to find the most likely trend reversal points. You will no longer find a copyright indicator like this. A simple
フィルタ:
レビューなし
レビューに返信