Andrew PitchFork
- インディケータ
- Mahmoud Sabry Mohamed Youssef
- バージョン: 8.0
Andrew Pitch fork is one of the most interesting string trend & Channel & Fibo technical analysis , it's like ALL in ONE tool would be very enough for you.
FYI, This indicator will expire by end of July 2022.
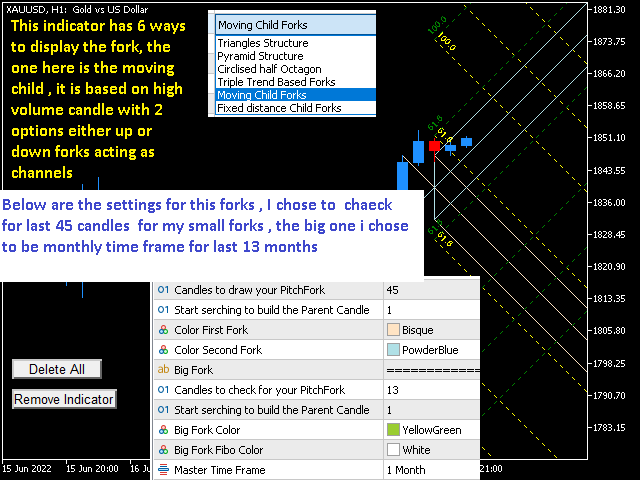
Using 2 Andrew pitch Forks with 2 different time frames on same chart is really very hard working and might be impossible , but with this indicator is possible now , moreover , using this method as Candle Volume based analysis give strong trust for your trade.
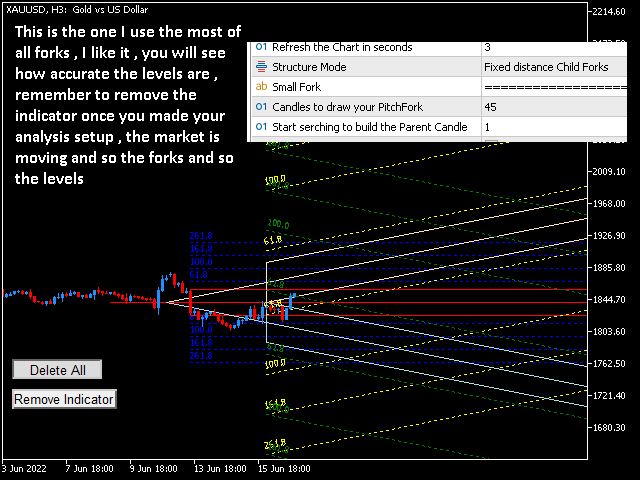
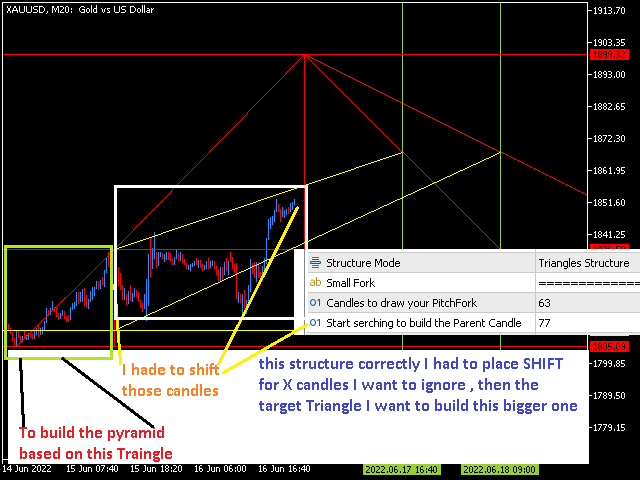
I assume if you are having 1 daily pith fork lets say with 22 Candle value , and another small pitch fork on 1 Hour Time frame with 45 candles value , if you are below the lower edges of the 2 forks it is good to start your incremental buy and the vice versa for sell , the levels are based on the candle itself.
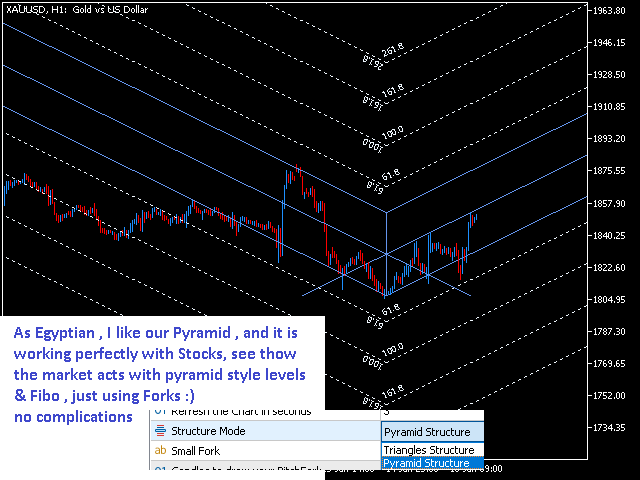
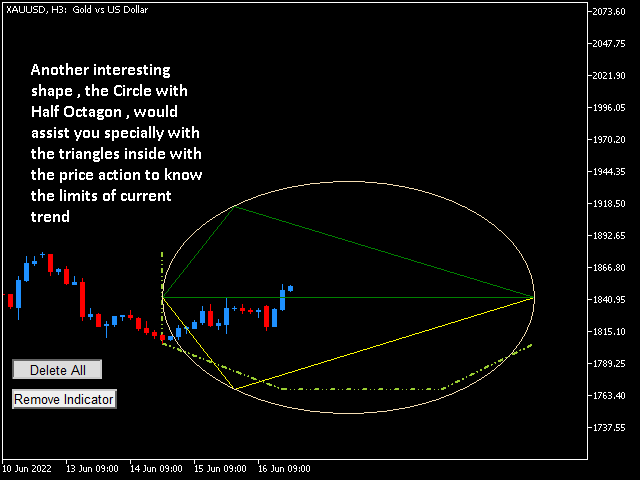
I will try to explain by video later on but for now just to give you a chance to test it , please be patient for in depth description for this indicator , you will be surprised that this is not just 1 indicator , it is 6 in 1 , you have 6 different methods to look to the price action.
Feel free to leave your comments and advice , will be happy to answer when I get time.
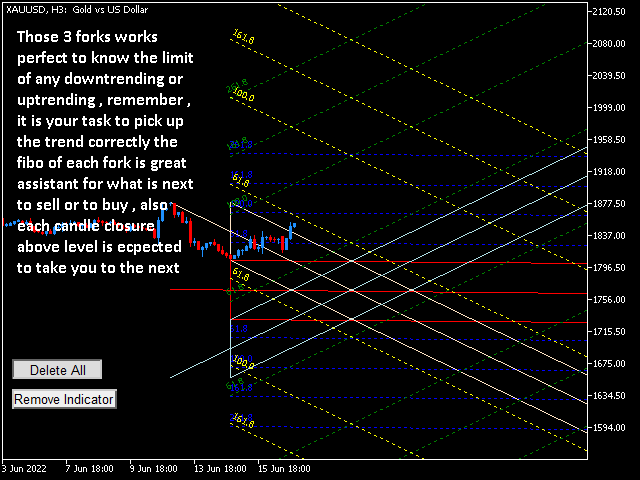


one of the strongest indicators for mt5 , tells you tops and bottoms , so you know the right direction to trdae