Ichimoku Trend Finder MT5
40% off. Original price: $50
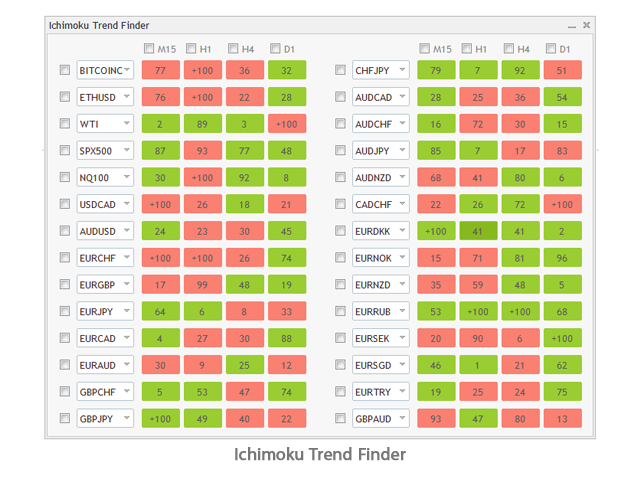
Ichimoku Trend Finder is a multi symbol multi timeframe trend dashboard that helps traders to monitor and identify potential market trends from one chart.
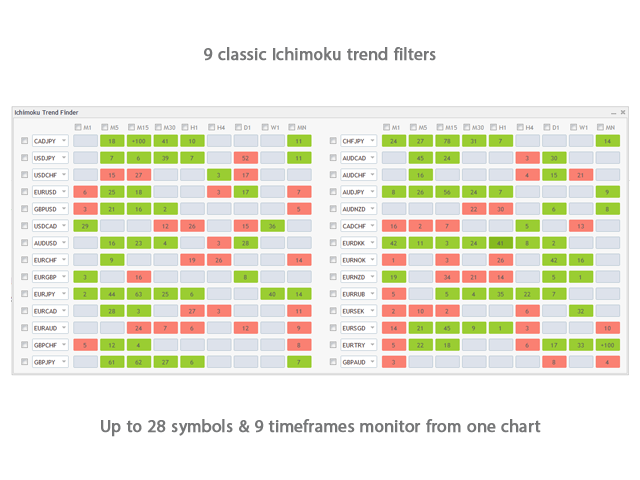
This panel scans the Ichimoku Kinko Hyo indicator in 28 configurable instruments and 9 timeframes for classic Ichimoku trend signals with a deep scan feature to scan all market watch symbols (up to 1000 instruments!).
Ichimoku Trend Finder features:
- Multi timeframe, multi symbol customizable scan of the Ichimoku indicator.
- Scans Ichimoku cloud, Tenkan sen(Conversion Line), Kijun sen(Base Line), Senkou span A, Senkou span B, and Chikou span relative to price, and more.
- Deep Scan mode to scan all market watch symbols for Ichimoku trend in a chosen timeframe.
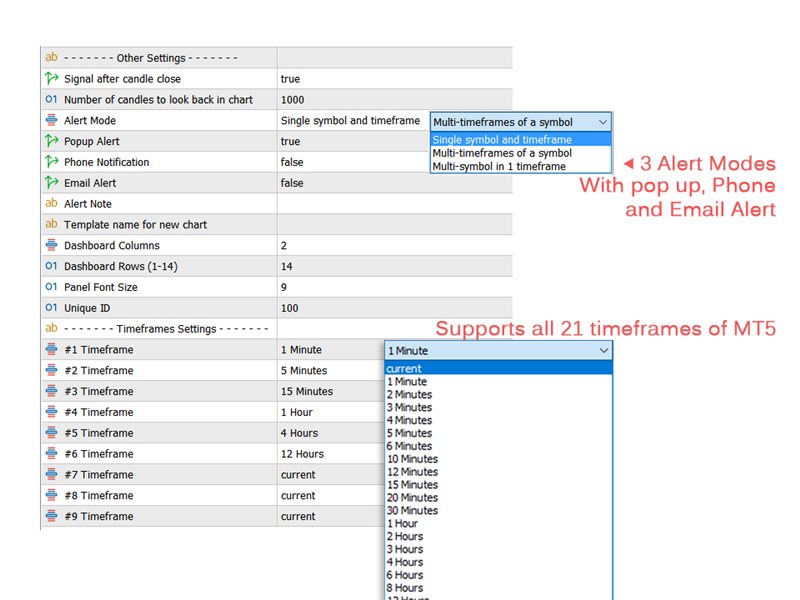
- You can choose between 3 alert modes:
- Single symbol and timeframe
- Multiple timeframes of a symbol
- Multiple symbols for a timeframe
- Support all 21 timeframes of MT5.
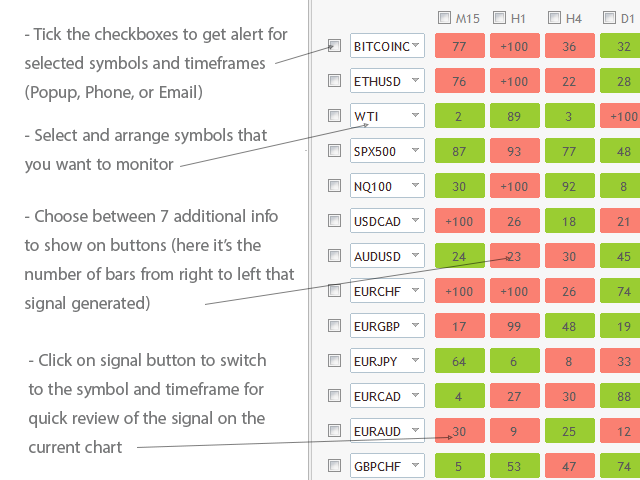
- Quick review of signals on the same chart by clicking on signal buttons.
- Easy setup and arrange of symbols in any order with any instrument that your broker provides.
- Popup, email, and phone notification alerts for selected symbols and timeframes.
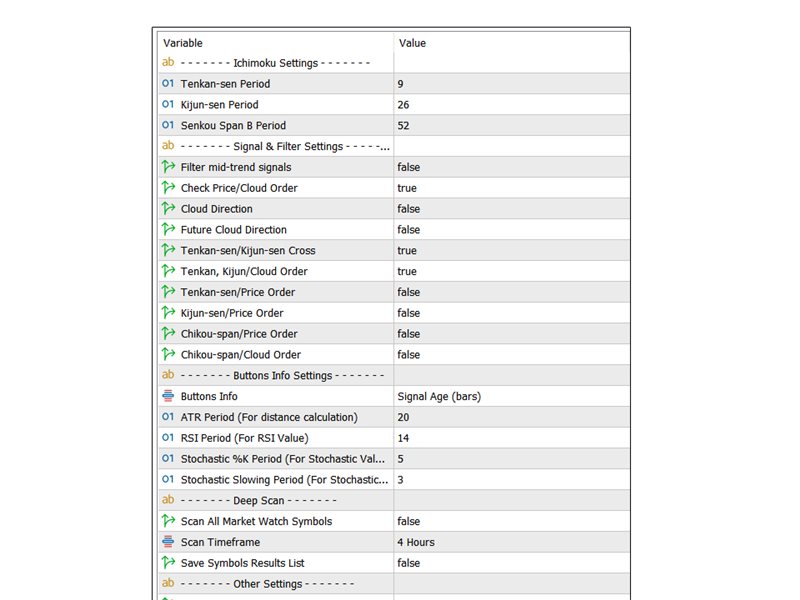
There are 9 classic Ichimoku trend filters you can enable/disable in settings, when these conditions are met dashboard cell turns "green/red":
Price/Cloud Order: Checks the price position relative to the cloud.
Cloud Direction: Checks the current cloud color to see if its direction turned yet or not (Senkou span A and B order).
Future Cloud Direction: Checks if the future cloud direction matches the price/cloud position (Shifted Senkou span A and B order).
Tenkan-sen/Kijun-sen Cross: Checks if Tenkan sen crossed Kijun sen in the direction of the trend.
Tenkan, Kijun/Cloud Order: Checks if both Tenkan sen and Kijun sen are above the cloud in an uptrend or below the cloud in a downtrend.
Tenkan-sen/Price Order: Checks if price is above Tenkan sen in uptrend or below Tenkan sen in downtrend.
Kijun-sen/Price Order: Checks if price is above Kijun sen in uptrend or below Kijun sen in downtrend.
Chikou-span/Price Order: Checks if Chikou span is above price in uptrend or below price in downtrend.
Chikou-span/Cloud Order: Checks if Chikou span is above the cloud in uptrend or below the cloud in downtrend.
Dashboard buttons:
By clicking on dashboard signals you can open the symbol and timeframe of the signal on the current chart. You can also choose between 6 information about the signal to show on dashboard buttons:
- Cloud Height, based on ATR value of the symbol and timeframe.
- Price to Cloud Distance, based on ATR.
- Price vs Cloud Cross Age, which shows the number of the bar from right to left that price crossed the cloud.
- Price to Kijun-sen Distance, based on ATR like above.
- RSI Value of RSI indicator.
- Stochastic Value of Stochastic indicator.
- Signal age shows the number of the bar from right to left that signal occurred.
Note that button info doesn't work as a signal filter and it's just additional information.
Some Notes:
- The signals of this Ichimoku scanner are not Buy/Sell signals. They indicate a potential market trend that should be checked. If you have a particular Ichimoku trading system you can set up the indicator accordingly to get buy/sell signals.
- If you want to monitor more than 28 instruments in Ichimoku dashboard you can load the indicator on another chart, set a different "Unique ID" in the indicator settings and set different symbols for it.
- The symbols that you want to add to the dashboard must be visible in the MetaTrader market watch window. The first time you run the indicator or load a new symbol in the dashboard it might take a few seconds to update its data and show signals.








Perfect