Trend Symbol One Click Currency Correlations
- インディケータ
- Senmune Toyokawa
- バージョン: 1.0
- アクティベーション: 5
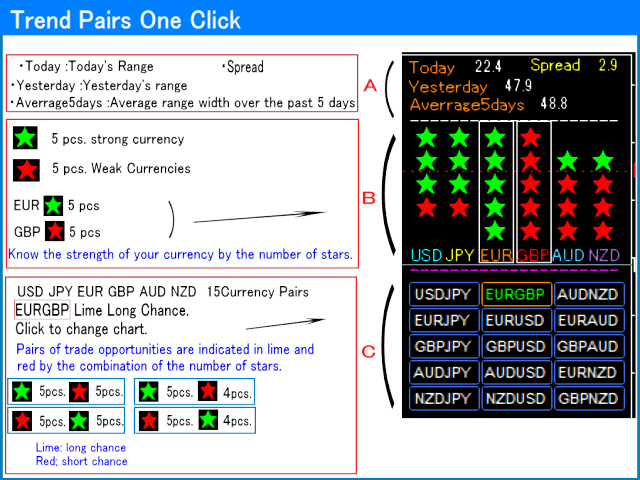
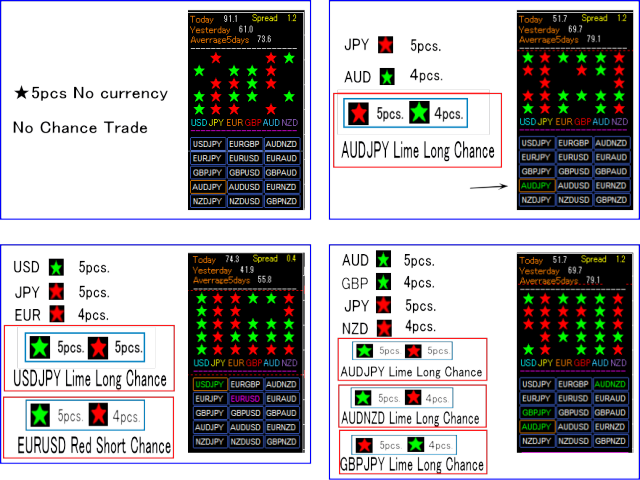
Currency Strength Meter
1:Correctly identifying trends in foreign exchange investments is critical.
2:TrendSymbolOneClick quickly detects and displays trends that have just begun and those that have already been in place for an extended period of time.
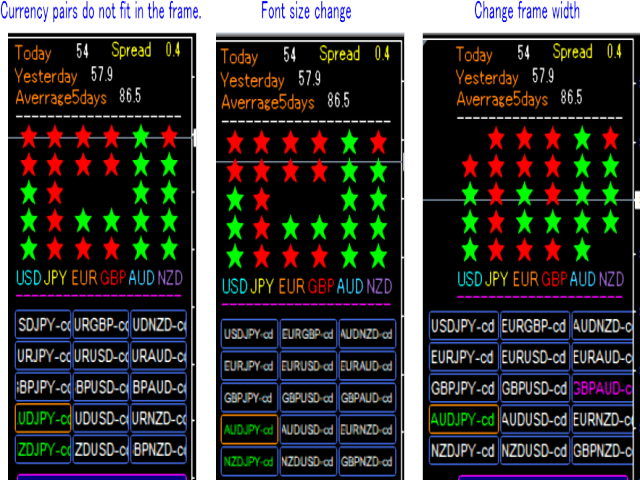
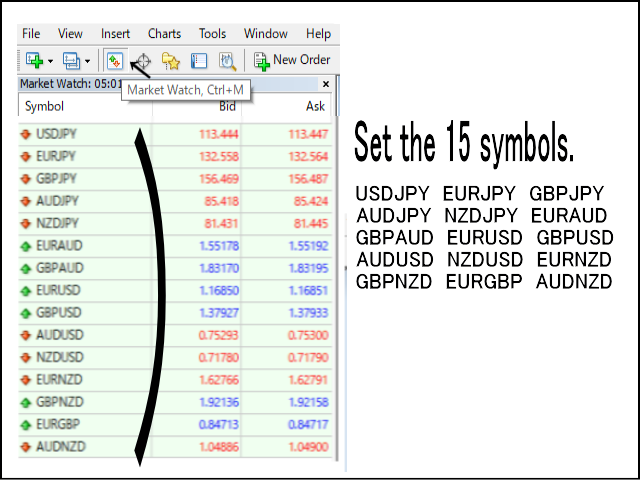
3:There is also a USD JPY EUR GBP AUD NZD strength function.
4:Volatility allows you to know exactly when there is a major market move.
5:You can save time in your market analysis by using Trend Symbol One Click.
6:Analysis available from 1 minute to weekly
7:The clear and simple display on the chart makes it easy for even beginners to learn how to use it.