RSI Divergence Indicator MT5
RSI divergence indicator finds divergences between price chart and RSI indicator and informs you with alerts (popup, mobile notification or email). Its main use is to find trend reversals in the chart.
Always use the divergence indicators with other technical assets like support resistance zones, candlestick patterns and price action to have a higher possibility to find trend reversals.
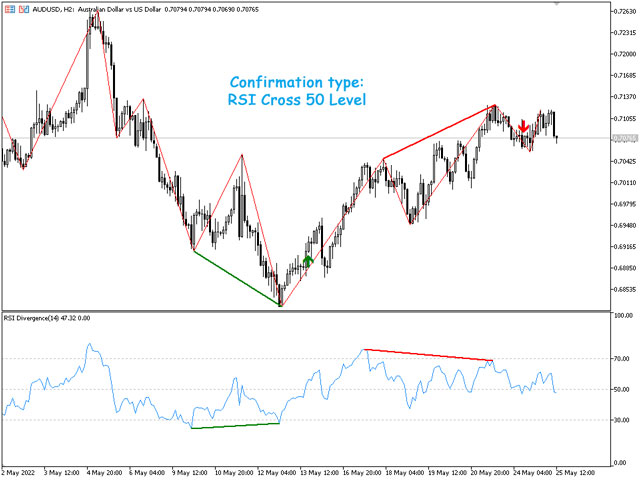
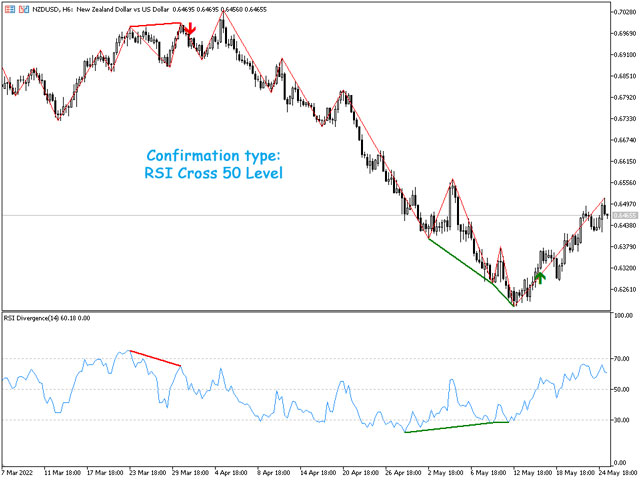
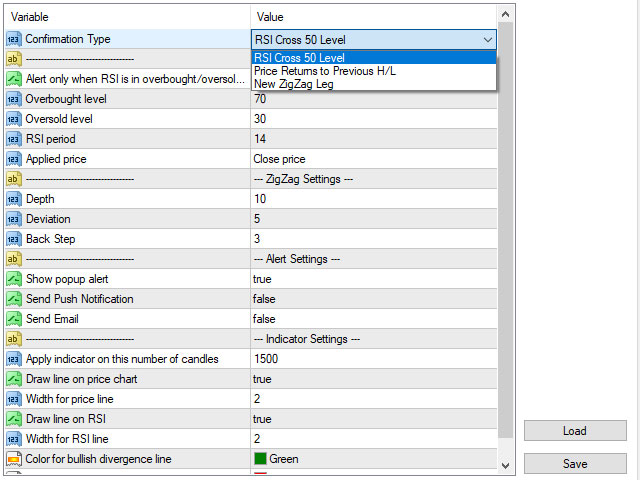
Three confirmation type for RSI divergences:
- RSI line cross 50 level
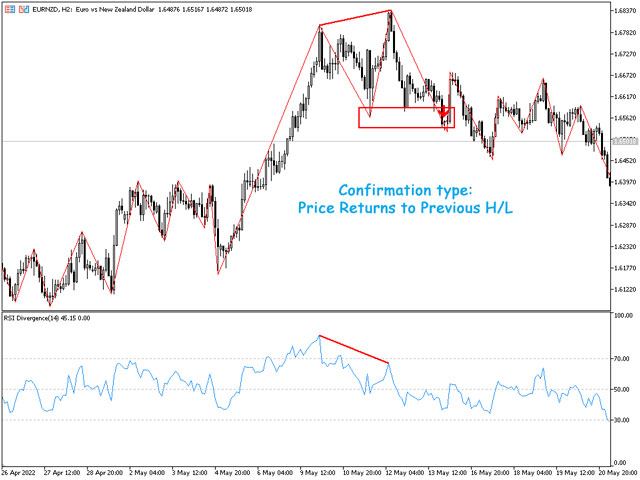
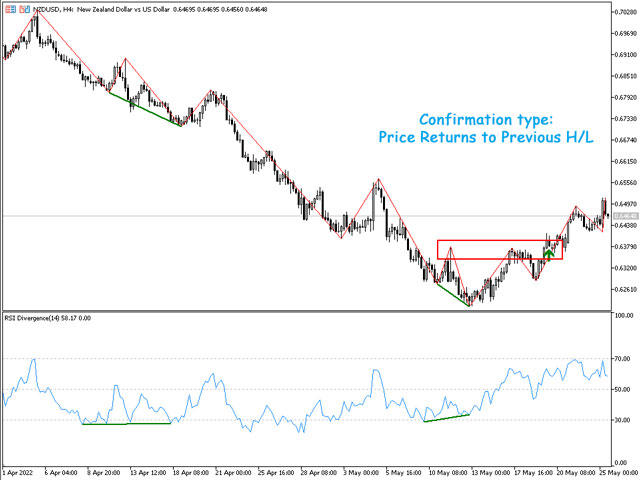
- Price returns to previous H/L
- Creating a new ZigZag leg in price chart
- No Confirmation (Immediate Alert): it repaints and deletes the signal if it invalidated
When divergence is confirmed, the indicator draws an arrow on the chart (not for the new ZigZag leg confirmation type).
This indicator uses ZigZag indicator to determine trend direction and HH/LL of the price, you can change the ZigZag parameters in the indicator's input window. You can add the ZigZag Indicator to your chart template to have a better look of painted divergences.
- You can set the indicator to alert only when RSI divergence occurs in the overbought/oversold levels.
- The indicator has four buffers that you can use in your EA, "RSI" buffer shows the RSI value ,"Divergence Type" Buffer shows "1" for bullish divergences and "-1" for bearish divergences and other buffers show the start and end positions of divergence line . You can check them out in the "Data Window" (Ctrl+D).
You can check out the multi-timeframe/multi-symbol version of this indicator from this link.


Indicador muito bem feito, e a analise do trade é maravilhosa, o indicador opera divergence no RSI junto com topos e fundos do gráfico, mas só dar entrada depois do rompimento do pivor confirmando a tendencia de Charles Dow, só ai é mostrada uma seta que é inclusive está definida como buffer também, deixando a automatização desse indicador incrivelmente simples e fácil de fazer para desenvolvedores, muito obrigado por essa estratégia e essa ferramenta incrível que você construiu