RSI Dashboard Scanner
- インディケータ
- Teddy Mutugi Mworia Teddy Mutugi Mworia
- バージョン: 2.0
- アップデート済み: 9 8月 2022
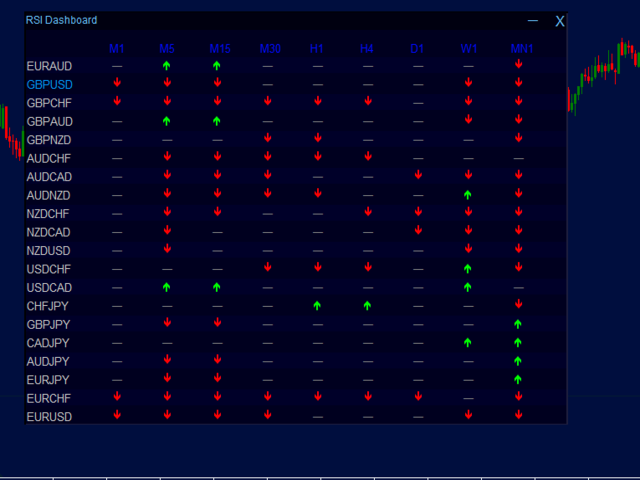
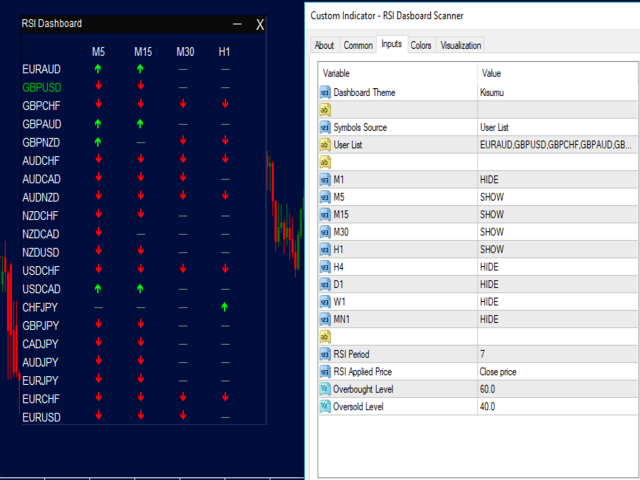
This indicator scans multiple pairs on multiple timeframes for RSI values and draws green up arrows for RSI overbought values and red down arrows for oversold RSI values in realtime.
Features
•Animated rows plotting
•Resizable
•Repositionable
•Minimisable
•Multiple dashboard themes
•Multiple timeframes
•You can open a pair by clicking it
•Current chart pair marked by a different color
•Use market watch pairs or your own list of pairs
•Choose the timeframes to display


Completely admirable! Good stuff, my respect to you!