Analise Probabilistica
- インディケータ
- Valter Cezar Costa
- バージョン: 1.6
- アップデート済み: 29 1月 2024
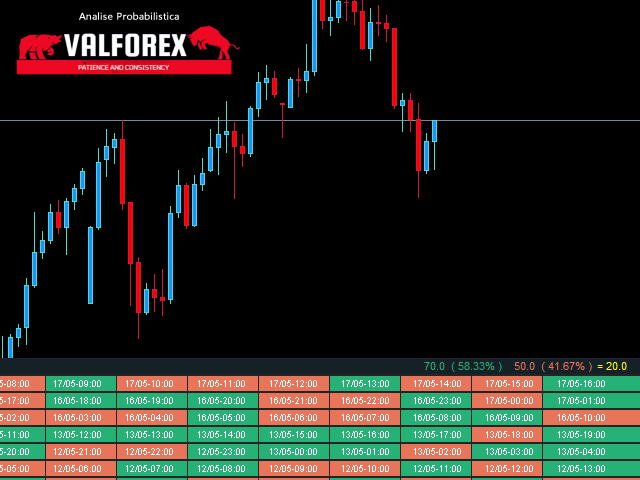
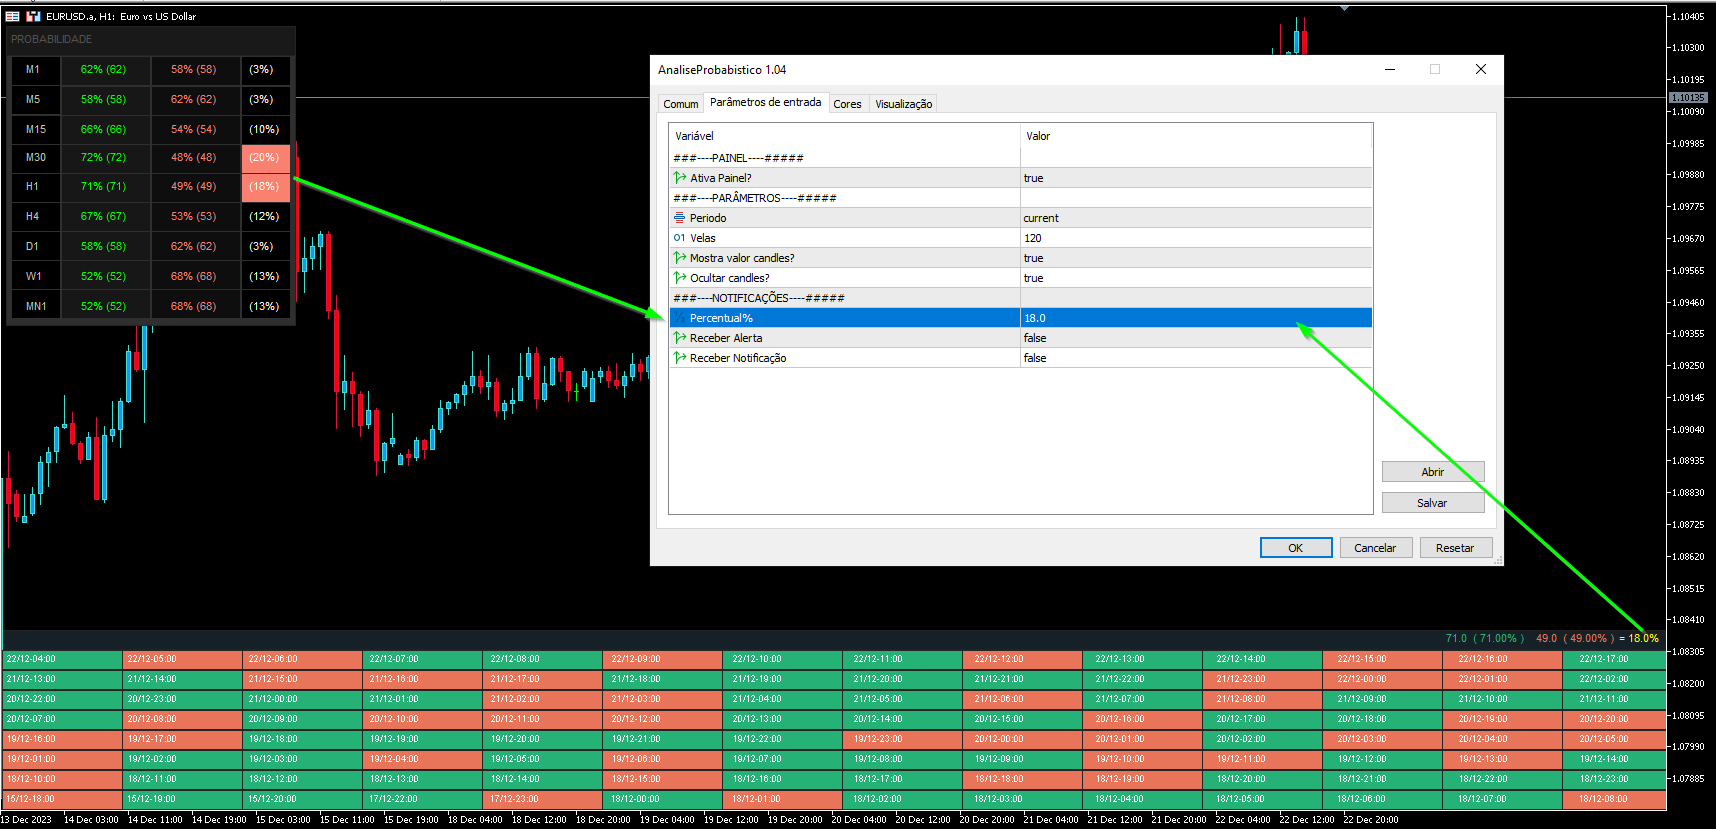
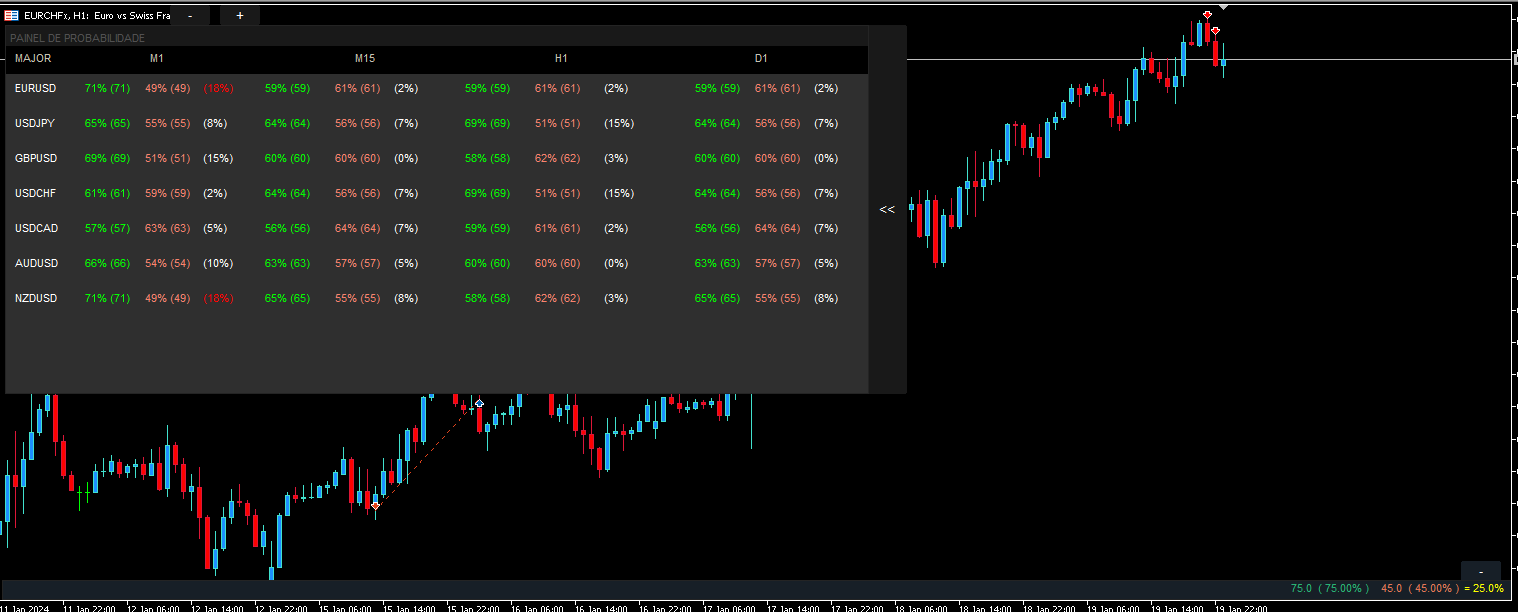
I'm sure after a lot of research on the internet, you haven't found any indicator that can help you with forex or binary trading in the latest probability strategy created by famous trader Ronald Cutrim. The strategy is based on a simple count of green and red candles, checking for a numerical imbalance between them over a certain period of time on an investment market chart. If this imbalance is confirmed and is equal to or greater than 16%, according to trader Ronald Cutrim, creator of the probabilistic strategy, there is the opportunity to enter a buy or sell order, always tending to account for fewer colors. Improvements: New Symbol Panel functionality: to more easily monitor the imbalance, you can enter the desired pairs in the parameter. 1 - Alert Notification. 2 - Notification for cell phone. Video about the strategy: https://www.youtube.com/watch?v=Dy9jlWsDSTA
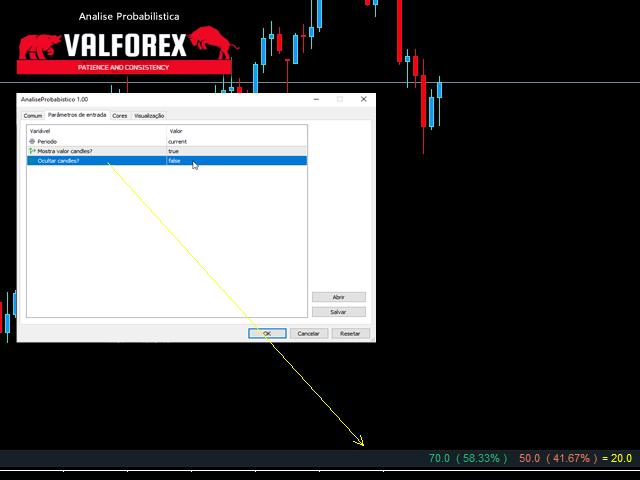


Para o que se propõe, o indicador é muito bom e preciso. Funcionou muito bem no meu MT5. Vi observações sobre estar atrapalhando a visão do gráfico, mas isso é facilmente ajustado, bastando clicar algumas vezes no pequeno sinal de "-" que fica acima dos valores percentuais e numéricos , logo acima dos quadros verdes e vermelhos. A função suprime a matriz de quadros do gráfico e temos sempre visível as informações mais importantes: a quantidade e percentuais de barras "para cima e para baixo" e a diferença percentual entre elas. Se desejar rever os quadros, basta clicar novamente no sinal. Indicador TOP e muito útil para a estratégia. Parabéns pelo projeto.