• 概要
  • レビュー (1)
  • コメント
  • 最新情報

Stochastic Advanced MT5

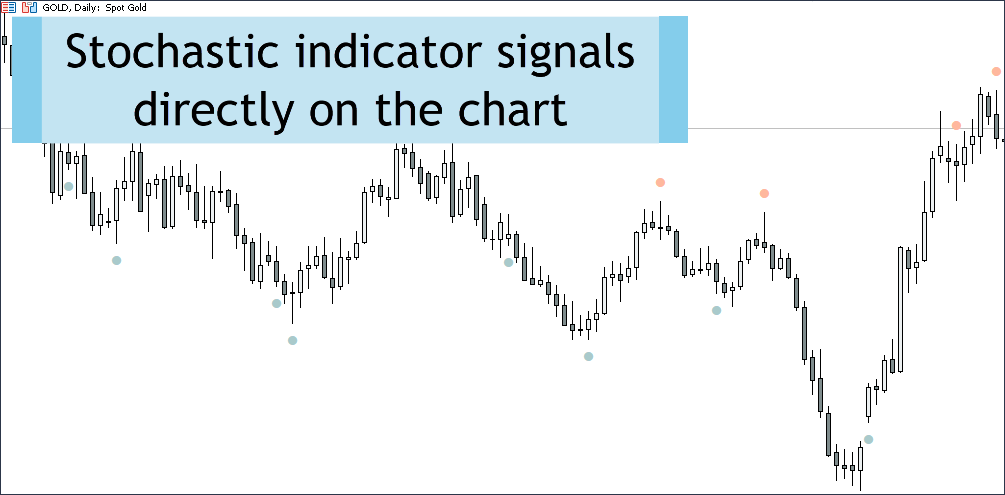
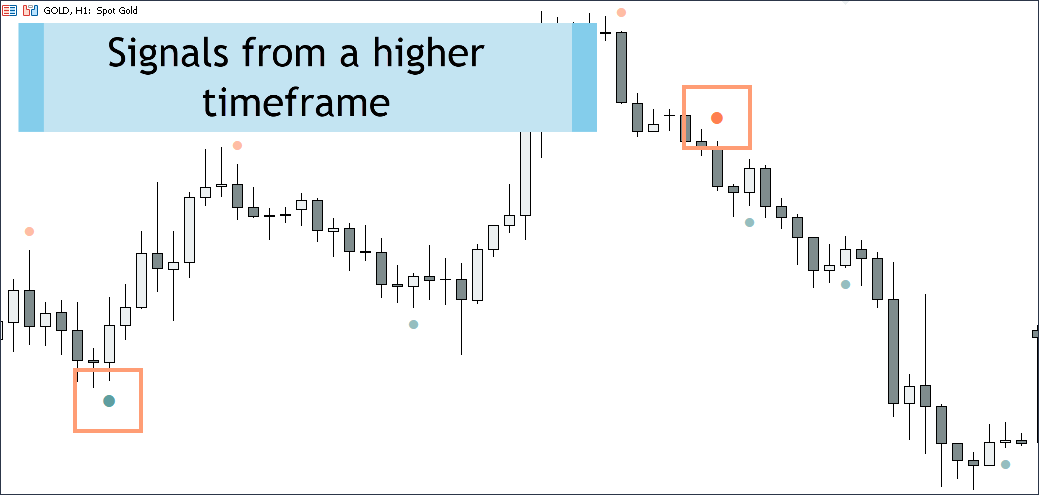
The "Stochastic Advanced" indicator displays the signals of the 'Stochastic" indicator directly on the chart without the presence of the indicator itself at the bottom of the screen. The indicator signals can be displayed not only on the current timeframe, but also on a timeframe one level higher. In addition, we have implemented a filter system based on the Moving Average indicator.

Manual (Be sure to read before purchasing) | Version for MT4

Advantages

1. Displaying the signals of the "Stochastic" indicator directly on the chart without the presence of the indicator itself

    2. The ability to display on the current chart not only current signals, but also signals one time frame higher

    3. A filter system similar to the “Three Screens of Elder” strategy. Allows you to leave only trend signals

    4. Indicator customization system. You can change the type, color and size of indicator signals

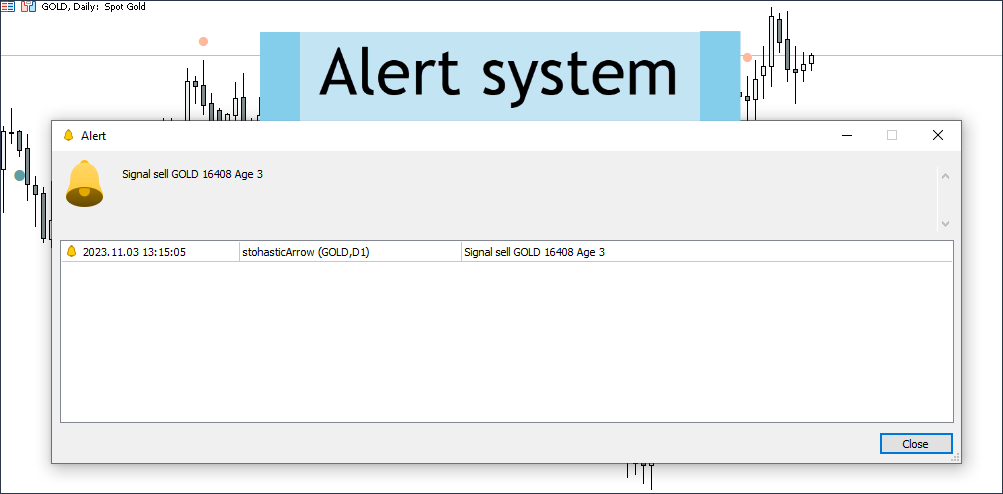
    5. Alert system. If there is a signal on the price chart, the indicator will notify you about it

    Author: Siarhei Vashchylka. For any questions, write to me in private messages. I also recommend subscribing to my updates. To do this, follow the link to my profile and click "Add to friends".
    おすすめのプロダクト
    SlopeChannelB – 価格の傾斜チャネルを構築するテクニカル分析ツールで、市場の現状を評価し、取引シグナルを見つけるためのユニークな機会を提供します。 インジケーターの主な特徴: 価格の傾斜チャネル : このインジケーターは、サポートとレジスタンスのレベルを視覚化するのに役立ち、トレンドの逆転または継続の可能性を示すことができます。 ラインの色と背景の強調表示が異なる : 傾斜したサポートとレジスタンスのレベルは異なる色で表示され、チャネル自体はさらに背景で強調され、チャートの視覚的分析を簡素化します。 ライン計算のための3つのオプション : このインジケーターは回帰分析を使用してチャネルラインを構築します。3つの方法から選択できます: Robust(デフォルト) – 外れ値に強い方法。 OLS(最小二乗法) . Median(中央値計算) . 最適なモデル選択 : SlopeChannelBは5つの品質基準の分析に基づいて最も適切なチャネルラインのバリエーションを自動的に選択します。 品質パラメータはチャートに直接表示され、結果の評価に役立ちます。また、ボタンを使
    Stochastic  Reversal  allows you to recognize reversals professionally. Stochastic Indicator: This technical indicator was developed by George Lane more than 50 years ago. The reason why this indicator survived for so many years is because it continues to show consistent signals even in these current times. The Stochastic indicator is a momentum indicator that shows you how strong or weak the current trend is. It helps you identify overbought and oversold market conditions within a trend.  Rules
    Ichimoku Kinko Hyo is a purpose-built trend trading charting system that has been successfully used in nearly every tradable market. It is unique in many ways, but its primary strength is its use of multiple data points to give the trader a deeper, more comprehensive view into price action. This deeper view, and the fact that Ichimoku is a very visual system, enables the trader to quickly discern and filter "at a glance" the low-probability trading setups from those of higher probability. This i
    Advanced 4xZeovo MT5 Indicator (MetaTrader 5)   Product Description  4xZeovo is a powerful trading indicator system monitoring 24/7 financial markets. Metatrader5 tool designed to find the best buying/selling opportunities and notifies the user.    Making life easy for traders in helping with the two most difficult decisions with the use of advanced innovate trading indicators aiming to encourage users to hold the winning positions and take profit at the best times.    Equipped with a unique tra
    Macd Rsi
    Ignacio Agustin Mene Franco
    macd rsi It is a macd indicator added to the rsi to capture perfect entries in the average crossovers! As seen in the indicator, it has 2 lines, one of gold color and the other violet line, where the cross of the violet with the gold downwards is a sell signal when it crosses the violet up from the gold it is a buy signal! very good to make shorts works for forex markets and synthetic indices It is used in any temporality! Good profit! World Investor.
    Supertrend indicator uses a combination of a moving average and average true range to detect the trend of a trading instrument. Supertrend indicator for MetaTrader 5 easily shows the trend as a line following the price. Triple SuperTrend Histo indicator  calculate  three supertrends to show the trend as a histogram. Changing the color from red to green means you can BUY , from green to red means you can SELL . Description of the method of drawing a histogram. The price is above the EMA 200,
    The Hi Low Last Day ( Hi Lo Last Day ) indicator shows the high and low of the last trading day and the second trading day, as well as the minimum and maximum of last week . There are many trading strategies on the daily levels. This indicator is indispensable when using such trading strategies. In fact, everything is simple in trading, you just need to understand and accept it for yourself. There is only price!!! What is price? This is the level on the chart. The level is the price that the buy
    All about time and price by ICT. This indicator provides a comprehensive view of ICT killzones, Silver Bullet times, and ICT Macros, enhancing your trading experience.  In those time windows price either seeks liquidity or imbalances and you often find the most energetic price moves and turning points. Features: Automatic Adaptation: The ICT killzones intelligently adapt to the specific chart you are using. For Forex charts, it follows the ICT Forex times: In EST timezone: Session: Asia: 20h00-0
    The indicator detects divergence signals - the divergences between the price peaks and the MACD oscillator values. The signals are displayed as arrows in the additional window and are maintained by the messages in a pop-up window, e-mails and push-notifications. The conditions which formed the signal are displayed by lines on the chart and in the indicator window. The indicator parameters MacdFast - fast MACD line period MacdSlow - slow MACD line period MacdSignal - MACD signal line period Macd
    Range Target
    Ignacio Agustin Mene Franco
    Range Target! indicator that marks the depletion of strength of the candle where it touches the floor and catches a trend, whether it is up or down The indicator has two support lines where it marks the floor and the ceiling. where on the same line marks the entry for rise or fall, the lines have Gold and Blue colors the gold line shows the purchase the blue line shows the sale works for any season works for forex markets works for synthetic index markets! Good Profit, World Investor.
    MT4版  |  FAQ Owl Smart Levels Indicator は、 Bill Williams の高度なフラクタル、市場の正しい波構造を構築する Valable ZigZag、エントリの正確なレベルをマークする Fibonacci レベルなどの一般的な市場分析ツールを含む 1 つのインジケーター内の完全な取引システムです。 利益を得るために市場と場所に。 戦略の詳細な説明 インジケータを操作するための指示 顧問-取引助手 プライベートユーザーチャット ->購入後に私に書いて、私はプライベートチャットにあなたを追加し、あなたはそこにすべてのボーナスをダウンロードすることができます 力はシンプルさにあります! Owl Smart Levels 取引システムは非常に使いやすいので、専門家にも、市場を勉強し始めて自分で取引戦略を選択し始めたばかりの人にも適しています。 戦略と指標に秘密の数式や計算方法が隠されているわけではなく、すべての戦略指標は公開されています。 Owl Smart Levels を使用すると、取引を開始するためのシグナルをすばやく確認し、注文を出すための
    Vortex MT5
    KEENBASE SOFTWARE SOLUTIONS
    The Vortex Indicator was first presented by Douglas Siepman and Etienne Botes in January 2010 edition of Technical Analysis of Stocks & Commodities. Despite its based on a complex implosion phenomenon, the vortex is quite simple to interpret. A bullish signal is generated when +VI line cross above the -VI line and vice versa. The indicator is mostly used as a confirmation for trend trading strategies. The Vortex was inspired by the work of Viktor Schauberger, who studied the flow of water in tur
    This indicator can be considered as a trading system. It offers a different view to see the currency pair: full timeless indicator, can be used for manual trading or for automatized trading with some expert advisor. When the price reaches a threshold a new block is created according to the set mode. The indicator beside the Renko bars, shows also 3 moving averages. Features renko mode median renko custom median renko 3 moving averages wicks datetime indicator for each block custom notification
    Basic information. To perform its work, the indicator takes data on volumes from a lower timeframe, builds Market Profiles for a higher timeframe and a histogram for the current timeframe. The indicator starts in several stages. In this case, messages like: "Build Source & Target TF. Step: …" are output to the log. The process can be accelerated by changing the input parameter Milliseconds between steps - the initialization speed. The final value of this parameter is always individual and is set
    STRICTLY FOR BOOM INDEX ONLY!!!!! Here I bring the Maximum Trend Arrows OT1.0 MT5 indicator. This indicator is made up of a combination of different trend indicators for entries and exits, for entries an orange arrow will paint on the chart below the current market and a red flag for closing of trades and it produces buy arrows only. When the orange arrow appears, it will appear along with it's sound to notify you. The 1H timeframe is recommended, don't use it anywhere else than on the 1H timefr
    Oscilador Yacht
    Ignacio Agustin Mene Franco
    Package Yacht indicator 2/3 Oscillator yacht, has the strategy of breakouts with the oscillator in the levels, 1.05, 0.50, 0.00, 050 and 1.05 are 5 levels where the volume no longer gives in the period of 1.05 on the lower side, the red candle begins to form, rising ay gives long signal, where it verifies it with 3 yellow, green and red dots, the same is for short when it breaks the green level, and breaks the line changing color starts entry works for forex markets and synthetic indices all tem
    Description : Rainbow EA MT5 is a simple Expert advisor based on   Rainbow MT5 indicator witch is based on Moving average with period 34. The indicator is incorporated in the EA, therefore, it is not required for the EA to operate, but if you wish, you can download it from   my product page . The Expert Advisor settings are as follows : Suitable for Timeframes up to H1 The parameters below can be set according to your trading rules. StopLoss ( Stop Loss in pips) TakeProfit ( Take Profit in pips
    Fractal Advanced - displays Fractal and Alligator indicators on the price chart. Has wide options for settings and customization. It is also equipped with alerts and a hotkey system. Manual (Be sure to read before purchasing) | Version for MT4 Advantages 1. The indicator does not fill the entire chart with fractals, but allows you to display only relevant signals. 2. The number of fractals is adjusted by scrolling the mouse while holding down the Shift key. 3. Instantly show/hide the Alligator
    Type: Oscillator This is Gekko's Cutomized Moving Average Convergence/Divergence (MACD), a customized version of the famous MACD indicator. Use the regular MACD and take advantage of several entry signals calculations and different ways of being alerted whenever there is potential entry point. Inputs Fast MA Period: Period for the MACD's Fast Moving Average (default 12); Slow MA Period: Period for the MACD's Slow Moving Average (default 26); Signal Average Offset Period: Period for the Signal A
    it depends on ATR period to get swing points to help make better trading decisions  blue dot and red dot is the default color scheme of course you can change it later if you'd like  you can change the following : ATR PERIOD  sending notifications number of times to send notifications  sending notifications to your smart phone that's it very simple to use just drag and drop and follow the trend 
    The main advantage of this indicator is filtering of buy and sell signals in the direction of the market impulse and ranking them by strength. Configuration of the indicator is simple and intuitive. All you need to do is to react only to strong signals. Adhere to the money management rules. Description The Color Stochastic with an analytical panel indicator consists of the Stochastic indicator itself and the information/analytics panel. The indicator provides options for configuring the paramet
    The Fractals indicator displays on the chart only fractals with the specified parameters in the indicator settings. This allows you to more accurately record a trend reversal, excluding false reversals. According to the classical definition of a fractal, it is a candlestick - an extremum on the chart, which was not crossed by the price of 2 candles before and 2 candles after the appearance of a fractal candle. This indicator provides the ability to adjust the number of candles before and after t
    40% off. Original price: $50 Advanced Bollinger Bands Scanner is a multi symbol multi timeframe Bollinger bands dashboard that monitors and analyzes the Bollinger Bands indicator from one chart. This panel scans the Bollinger bands indicator in up to 28 configurable instruments and 9 timeframes for price overbought/oversold, price consolidation (Bollinger bands squeeze), and consolidation breakout (squeeze break)  with a deep scan feature to scan all market watch symbols (up to 1000 instrument
    Advanced Trading Chaos  The main purpose of the indicator is to help the trader detect the signals described by Bill Williams in his books to make a quick and correct trading decision. 1)Bullish/Bearish Reversal Bar(BDB) 2) Divergent Bar(DB) 3) Second Sage Signal — the third consecutive Awesome Oscillator bar  4) Working fractals (Fractals that worked above/below the red forehead  5) Three bar coloring modes  5.1) Coloring of bars according to the AO indicator (Including the squatting bar)  5.2
    Ichimoku Aiko MTF
    Michael Jonah Randriamampionontsoa
    Ichimoku Aiko MTF is a collection of technical indicators that show support and resistance levels, as well as momentum and trend direction. It is a multi-timeframe indicator so you don't need to change the chart timeframe when you want to see the ichimoku clouds on a higher timeframe.  eg. The chart timeframe is M15 and you want to see on the M15 timeframe chart the H1 ichimoku indicators (the ichimoku in Metatrader can't do that) that's why you need to use Ichimoku Aiko MTF.
    The standard Bollinger Bands indicator has been improved by integrating additional indications from the Standard Deviation indicator (StdDev), which gives an additional filter for confirming trading signals. In addition, the color of the indicator's lines shows the beginning of a trend, its development and exhaustion. This indicator has a signal block that notifies the trader of the beginning of the trend on any time frame to which it is attached. Settings Type of messages - select the type of
    Divergence MACD indicator shows price and MACD indicator divergence. The indicator is not redrawn! The algorithm for detection of price and MACD extremums has been balanced for the earliest entry allowing you to use the smallest SL order possible. The indicator displays all types of divergences including the hidden one, while having the minimum number of settings. Find out more about the divergence types in Comments tab. Launch settings: Max Bars - number of bars calculated on the chart. Indent
    FXC iDeM-DivergencE MT5 Indicator This is an advanced DeMarker indicator that finds trend-turn divergences on the current symbol. The indicator detects divergence between the DeMarker and the price movements as a strong trend-turn pattern. Main features: Advanced divergence settings Price based on Close, Open or High/Low prices Give Buy/Sell open signals PUSH notifications E-mail sending Pop-up alert Customizeable Information panel Input parameters: DeM Period: The Period size of the DeMarker in
    Extreme indicator
    Ignacio Agustin Mene Franco
    Extreme indicator! is an oscillator that works with candle volume levels, where it consists of red and green colors, where you measure the sale and purchase! where it also comes with a line crossing format where it reconfirms the purchase or sale on this occasion, works for forex markets and for the synthetic index markets ! It works for all seasons! Good profit! World Investor.
    Golden Spikes Detector Acknowledgement and Dedications:  The name of this indicator was Inspired by an Original; Mr Grant Koopman; a Knowledgeable and experienced Synthetics trader. I dedicate this indicator to Mr Grant.  Overview:   The Golden Spikes Premium is a groundbreaking trading indicator meticulously crafted for the Boom and Crash indices on the Deriv market. Tailored to meet the needs of discerning traders, this powerful tool operates exclusively on the one-minute timeframe, providing
    このプロダクトを購入した人は以下も購入しています
    Quantum TrendPulse を ご紹介します。これは、   SuperTrend   、   RSI   、および Stochastic のパワーを 1 つの包括的なインジケーターに組み合わせて、取引の可能性を最大限に引き出す究極の取引ツールです。精度と効率を求めるトレーダー向けに設計されたこのインジケーターは、市場のトレンド、勢いの変化、最適なエントリー ポイントとエグジット ポイントを自信を持って特定するのに役立ちます。 主な特徴: SuperTrend 統合: 現在の市場動向に簡単に追従し、収益性の波に乗ることができます。 RSI精度: 買われすぎと売られすぎのレベルを検出し、市場の反転のタイミングに最適で、SuperTrendのフィルターとして使用されます。 確率的精度: 確率的振動を活用して、変動の激しい市場で隠れたチャンスを見つけます。SuperTrend のフィルターとして使用されます。 マルチタイムフレーム分析:   M5 から H1 または H4 まで、さまざまなタイムフレームで市場を常に把握します。 カスタマイズ可能なアラート: カスタム取引条件が満たされ
    TPSpro TREND PRO は 、市場を自動的に分析し、トレンドとその各変化に関する情報を提供し、再描画せずに取引にエントリーするためのシグナルを提供するトレンド指標です。 インジケーターは各ローソク足を使用し、個別に分析します。上向きまたは下向きのさまざまな衝撃を指します。通貨、仮想通貨、金属、株、指数の取引への正確なエントリーポイント! バージョンMT5                   インジケーターの完全な説明     RFI LEVELS インジケーター と併用することをお勧めします。 主な機能: レンダリングなしで正確な入力信号! シグナルが表示されると、それは関連性を維持します。これは、シグナルを提供してからそれを変更し、その結果、入金された資金が失われる可能性があるリドローインジケーターとの重要な違いです。より高い確率と精度で市場に参入できるようになりました。矢印が表示された後、ターゲットに到達する (利益確定) か反転シグナルが表示されるまで、ローソク足に色を付ける機能もあります。 STOP-LOSS/TAKE-PROFITゾーンの表示 エントリーポイントを
    Golden Trend Indicator MT5
    Noha Mohamed Fathy Younes Badr
    4.86 (14)
    Golden Trend indicator  is The best indicator for predicting trend movement this indicator never lags and never repaints and never back paints    and give  arrow buy and sell    before the candle appear  and it will help you and  will make your trading decisions clearer its work on all currencies and  gold and crypto and all time frame This unique  indicator uses very secret algorithms to catch the  trends, so you can trade using this indicator and see the trend clear on charts  manual guide and
    指示する     ロシア     -        utilizar con   el indicador の ESP 推奨事項 -   TPSpro トレンド プロフェッショナル版 -   MT5のバージョン 最も重要なことは、将来においても最も重要なことです。 機能のプリンシパル: ゾーンのほとんどは、ベンダーとコンプラドールによってアクティブ化されます。 状況を直感的に把握できるよう、初期の衝動を修正します。 LOGIC AI: MUESTRA zonas (círculos) parabuscar puntos de entrada cuando se activa una plantilla 視覚的に優れた視覚効果があり、最も重要な機能がすべて揃っていることに注意してください。 優れたニベレス/ゾーンの視覚化 (modo MTF) 世界で最も人気のある場所/ゾーンです。これを使用するのに最適な方法です (   TPSproTREND PRO   )。 アルゴリズム プロフェッショナル セパラド パソ ア パソ パラ オペラ それは、オペラハウスやコントラ・デ・エラの指導におい
    これはMT5のインジケーターで、再描画なしで取引に参入するための正確なシグナルを提供します。 外国為替、暗号通貨、金属、株式、インデックスなど、あらゆる金融資産に適用できます。かなり正確な見積もりを提供し、取引を開始して終了するのに最適な時期を教えてくれます。1つのシグナルを処理しただけでインジケーターの元が取れた例の 動画 (6:22)をご覧ください。Entry PointsPro インジケーターの助けを借りたほとんどのトレーダーの最初の1週間の結果が改善しています。 Telegramグループ に登録してください。Entry Points Proインジケーターのメリットは次の通りです。 再描画のないエントリーシグナル 再描画されるインジケーターでは一度表示されたシグナルが削除されて大きな金銭的損失につながることがありますが、これと異なり、表示されて確認されたシグナルは消えることがありません。 エラーなしの取引開始 インジケーターアルゴリズムによって取引を開始する(資産を売買する)理想的な瞬間を見つけることができます。それを使用するすべてのトレーダーの成功率が向上します。 あら
    今、147ドル(いくつかの更新後に499ドルに増加します) - 無制限のアカウント(PCSまたはMac) RelicusRoad ユーザー マニュアル + トレーニング ビデオ + プライベート Discord グループへのアクセス + VIP ステータス 市場の新しい見方 RelicusRoad は、外国為替、先物、暗号通貨、株式、および指数の世界で最も強力な取引インジケーターであり、トレーダーに収益を維持するために必要なすべての情報とツールを提供します。初心者から上級者まで、すべてのトレーダーが成功するためのテクニカル分析と取引計画を提供します。これは、将来の市場を予測するのに十分な情報を提供する重要な取引指標です。意味をなさないチャート上のいくつかの異なる指標ではなく、完全な解決策を信じています.これは、信号、矢印 + 価格アクション情報を表示するオールインワンのインジケーターで、他に類を見ない非常に正確です。 強力な AI に基づいて、RelicusRoad は不足している情報とツールを提供して、あなたを教育し、トレーディングのプロ、成功したトレーダーにします。 ほと
    Was: $249  Now: $149   Market Profile defines a number of day types that can help the trader to determine market behaviour. A key feature is the Value Area, representing the range of price action where 70% of trading took place. Understanding the Value Area can give traders valuable insight into market direction and establish the higher odds trade. It is an excellent addition to any system you may be using. Inspired by Jim Dalton’s book “Mind Over Markets”, this indicator is designed to suit the
    TPA True Price Action indicator reveals the true price action of the market makers through 100% non-repainting signals strictly at the close of a candle! TPA shows entries and re-entries, every time the bulls are definitely stronger than the bears and vice versa. Not to confuse with red/green candles. The shift of power gets confirmed at the earliest stage and is ONE exit strategy of several. There are available now two free parts of the TPA User Guide for our customers. The first "The Basics"
    Fxaccurate Trend Trading is a method that focuses on identifying and capitalizing on market trends in the foreign exchange (Forex) market. This strategy is grounded in the principle that once a trend is established, it tends to persist, allowing traders to enter positions that align with the market's prevailing direction. Fxaccurate Trend Trading relies on various tools, indicators, and methodologies to spot, confirm, and trade in the direction of a trend, whether it’s upward (bullish) or downwa
    Bill Williams Advanced is designed for automatic chart analysis using Bill Williams' "Profitunity" system. The indicator analyzes four timeframes at once. Manual (Be sure to read before purchasing) Advantages 1. Automatically analyzes the chart using the "Profitunity" system of Bill Williams. The found signals are placed in a table in the corner of the screen. 2. Equipped with a trend filter based on the Alligator indicator. Most of the system signals are recommended to be used only according t
    このインディケータは、1つのウィンドウで複数のタイムフレームのトレン ド方向を表示します。複数のタイムフレームのトレンドが一致する場合、矢印が描かれます。 また、ヒストグラムに切り替えて、現在のタイムフレームのトレンドを表示することもできます。 このインディケータは、チャート上にエントリーポイントとおおよそのエグジットポ イントを描画します。 警告:このインディケータはマルチタイムフレームであるため、ストラテジーテスターで使用する場合は、必要なすべてのタイムフレームの相場を事前にダウンロードしておく必要があります。テスターで長い間相場のダウンロードを待たずに済むように、開始日を2025.01.01とし、モデルを「オープンプライスのみ」または「コントロールポイント」とすることができます。 MT4用インジケーターバージョン 特徴     このインディケータは再描画しません。ヒストリカルチャートに表示されているものがリアルタイムで表示されます。     暗号通貨、株式、金属、指数、商品、通貨など、あらゆる資産の取引に使用できます。     すべてのタイムフレームに対応。     エン
    Are you tired of missing out on the biggest opportunities in Boom and Crash trading? Mega Spikes Max is your ultimate tool for dominating the markets, giving you the precision and confidence you need to succeed. Why Choose Mega Spikes Max? Stay Ahead with Real-Time Alerts Never miss a profitable trade again. Get instant notifications directly to your mobile or desktop when a spike is imminent, even if you're away from your screen. Accurate Spike Detection Engineered for pinpoint accuracy, Mega
    !SPECIAL SALE!  The Trend Forecaster indicator utilizes a unique proprietary algorithm to determine entry points for a breakout trading strategy. The indicator identifies price clusters, analyzes price movement near levels, and provides a signal when the price breaks through a level. The Trend Forecaster indicator is suitable for all financial assets, including currencies (Forex), metals, stocks, indices, and cryptocurrencies. You can also adjust the indicator to work on any time frames, althoug
    KT Candlestick Patterns finds and marks the 24 most dependable Japanese candlestick patterns in real-time. Japanese traders have been using the candlestick patterns to predict the price direction since the 18th century. It's true that not every candlestick pattern can be equally trusted to predict the price direction reliably. However, when combined with other technical analysis methods like Support and Resistance, they provide an exact and unfolding market situation. KT Candlestick Patterns S
    Was: $299  Now: $149  Supply Demand uses previous price action to identify potential imbalances between buyers and sellers. The key is to identify the better odds zones, not just the untouched ones. Blahtech Supply Demand indicator delivers functionality previously unavailable on any trading platform. This 4-in-1 indicator not only highlights the higher probability zones using a multi-criteria strength engine, but also combines it with multi-timeframe trend analysis, previously confirmed swings
    ご紹介     Quantum Breakout PRO は 、ブレイクアウト ゾーンの取引方法を変革する画期的な MQL5 インジケーターです。 13年以上の取引経験を持つ経験豊富なトレーダーのチームによって開発されました。     クォンタム ブレイクアウト プロ   は、革新的でダイナミックなブレイクアウト ゾーン戦略により、あなたのトレーディングの旅を新たな高みに押し上げるように設計されています。 クォンタム ブレイクアウト インジケーターは、5 つの利益ターゲット ゾーンを備えたブレイクアウト ゾーン上のシグナル矢印と、ブレイクアウト ボックスに基づいたストップロスの提案を提供します。 初心者トレーダーにもプロのトレーダーにも適しています。 量子EAチャネル:       ここをクリック 重要!購入後、インストールマニュアルを受け取るためにプライベートメッセージを送ってください。 推奨事項: 時間枠: M15 通貨ペア: GBPJPY、EURJPY、USDJPY、NZDUSD、XAUUSD アカウントの種類: ECN、Raw、またはスプレッドが非常に低い R
    MetaForecast M5
    Vahidreza Heidar Gholami
    5 (2)
    MetaForecastは、価格データのハーモニクスに基づいて、どんな市場の未来を予測し視覚化します。市場が常に予測可能ではありませんが、価格にパターンがある場合、MetaForecastは可能な限り正確な未来を予測できます。他の類似製品と比較して、MetaForecastは市場のトレンドを分析することでより正確な結果を生成することができます。 入力パラメータ Past size (過去のサイズ) MetaForecastが将来の予測を生成するために使用するバーの数を指定します。モデルは選択したバー上に描かれた黄色の線で表されます。 Future size (将来のサイズ) 予測すべき将来のバーの数を指定します。予測された将来は、ピンクの線で表示され、その上に青い回帰線が描かれます。 Degree (程度) この入力は、MetaForecastが市場で行う分析のレベルを決定します。 Degree 説明  0 Degree 0の場合、価格の全てのピークや谷、そして詳細をカバーするために、「Past size」の入力に大きな値を使用することが推奨されています。  1 (推奨) Degre
    note: this indicator is for METATRADER4, if you want the version for METATRADER5 this is the link:  https://www.mql5.com/it/market/product/108106 TRENDMAESTRO ver 2.4 TRENDMAESTRO recognizes a new TREND in the bud, he never makes mistakes. The certainty of identifying a new TREND is priceless. DESCRIPTION TRENDMAESTRO identifies a new TREND in the bud, this indicator examines the volatility, volumes and momentum to identify the moment in which there is an explosion of one or more of these data a
    これはほぼ間違いなく、MetaTraderプラットフォームで見つけることができる最も完全な調和価格形成自動認識インジケーターです。 19種類のパターンを検出し、フィボナッチプロジェクションをあなたと同じように真剣に受け止め、潜在的逆転ゾーン(PRZ)を表示し、適切なストップロスとテイクプロフィットレベルを見つけます。 [ インストールガイド | 更新ガイド | トラブルシューティング | よくある質問 | すべての製品 ] 19の異なる調和価格形成を検出します プライマリ、派生および補完フィボナッチ投影(PRZ)をプロットします 過去の価格行動を評価し、過去のすべてのパターンを表示します この指標は、独自の品質とパフォーマンスを分析します 適切なストップロスとテイクプロフィットのレベルを表示します ブレイクアウトを使用して適切な取引を通知します すべてのパターン比をグラフにプロットします 電子メール/音声/視覚アラートを実装します スコット・M・カーニーの本に着想を得て、この指標は最も純粋で急を要するトレーダーのニーズを満たすように設計されています。ただし、トレードを容易にする
    The Volume by Price Indicator for MetaTrader 5 features Volume Profile and Market Profile TPO (Time Price Opportunity). Volume and TPO histogram bar and line charts. Volume Footprint charts. TPO letter and block marker collapsed and split structure charts. Static, dynamic and flexible range segmentation and compositing methods with relative and absolute visualizations. Session hours filtering and segment concatenation with Market Watch and custom user specifications. Graphical layering, positio
    Royal Scalping Indicator is an advanced price adaptive indicator designed to generate high-quality trading signals. Built-in multi-timeframe and multi-currency capabilities make it even more powerful to have configurations based on different symbols and timeframes. This indicator is perfect for scalp trades as well as swing trades. Royal Scalping is not just an indicator, but a trading strategy itself. Features Price Adaptive Trend Detector Algorithm Multi-Timeframe and Multi-Currency Trend Low
    Royal Wave Pro M5
    Vahidreza Heidar Gholami
    3.5 (4)
    Royal Wave is a Trend-Power oscillator which has been programmed to locate and signal low-risk entry and exit zones. Its core algorithm statistically analyzes the market and generates trading signals for overbought, oversold and low volatile areas. By using a well-designed alerting system, this indicator makes it easier to make proper decisions regarding where to enter and where to exit trades. Features Trend-Power Algorithm Low risk Entry Zones and Exit Zones Predictions for Overbought and Over
    Micro  ******************* Секундные графики MT5 ********************** Более точного инструмента для входа в сделку вы не найдёте. Входные параметры: Timeframe, sek - период построения графика, секунды Displayed bars - отображаемые бары Step of price levels, pp, 0-off - шаг отрисовки ценовых уровней, пункты Scale points per bar, 0-off - масштаб в пунктах на бар Show lines - отображение текущих уровней Show comment - отображение комментария Standard color scheme - стандартная цветовая сх
    If you need an indicator that shows market entry points, then this is your indicator.  The indicator is not redrawn. Shows buy and sell points for any TF (time frame) and any currency pair. Settings are adjustable for all instruments. You can configure each parameter for any broker, for any account. This is a PILLOW that is comfortable :)) Just check it out.....
    WHY IS OUR FXACCCURATE LS MT5 THE PROFITABLE ? PROTECT YOUR CAPITAL WITH RISK MANAGEMENT Gives entry, stop and target levels from time to time. It finds Trading opportunities by analyzing what the price is doing during established trends. POWERFUL INDICATOR FOR A RELIABLE STRATEGIES We have made these indicators with a lot of years of hard work. It is made at a very advanced level. Established trends provide dozens of trading opportunities, but most trend indicators completely ignore them! The
    説明 ICSM(Impulse-Correction SCOB Mapper)は、価格の動きを分析し、有効なインパルス、修正、およびSCOB(Single Candle Order Block)を識別するインジケーターです。柔軟性があり、情報量が多く、使いやすく、最も流動性の高い関心領域に対するトレーダーの認識を大幅に向上させるため、あらゆるタイプのテクニカル分析で使用できる強力なツールです。 設定 一般 | ビジュアル カラーテーマ — ICSMのカラーテーマを定義します。 SCOB | ビジュアル SCOBを表示 — SCOBを有効/無効にします; SCOBをマークする — SCOB表現のスタイルオプションのリストを表します; SCOB色 — SCOBの色を定義します; ICM | ビジュアル ICMラインを表示 — ICM(Impulse-Correction Mapper)ラインを有効/無効にします; ICトレンドを表示 — チャートの下部にある色付きの仕切りを通じてインパルス-修正トレンドの視覚化を有効/無効にします; ライン色 — ICMラインの色
    次世代の自動化された需要と供給のゾーン。どのチャートでも機能する新しい革新的なアルゴリズム。すべてのゾーンは、市場の価格行動に従って動的に作成されています。 2種類のアラート --> 1) 価格がゾーンに達したとき 2) 新しいゾーンが形成されたとき もう 1 つの役に立たない指標はありません。実績のある完全な取引戦略を手に入れることができます。     新機能:     価格が需給ゾーンに達したときにアラートを出す     新しい需給ゾーンが作成されたときにアラートを発します     プッシュ通知アラート     ピップ単位のゾーン幅ラベル     MTF のもう 1 つのタイムフレーム。したがって、現在より 2 時間足高いのではなく、現在より 3 時間足し上に見えるようになります。     アラート/ゾーン/MTF 機能を有効/無効にするボタン あなたが得る利点:     取引から感情を取り除きます。     取引エントリをオブジェクト化します。     確率の高いセットアップで利益を上げましょう。     描画ゾーンから時間を節約します。
    スイングトレーディング は、トレンドの方向のスイングと可能な反転スイングを検出するように設計された最初のインジケーターです。トレーディングの文献で広く説明されているベースラインスイングトレーディングアプローチを使用します。インディケータは、いくつかの価格と時間のベクトルを調査して、全体的なトレンドの方向を追跡し、市場が売られ過ぎまたは買われ過ぎて修正の準備ができている状況を検出します。 [ インストールガイド | 更新ガイド | トラブルシューティング | よくある質問 | すべての製品 ] むち打ちを起こさずに市場スイングの利益 インジケーターは常にトレンドの方向を表示します 色付きの価格帯は機会のベースラインを表します 色付きのダッシュは、可能な反転スイングを表します この指標は、独自の品質とパフォーマンスを分析します 複数時間枠のダッシュボードを実装します カスタマイズ可能なトレンドおよびスイング期間 電子メール/サウンド/プッシュアラートを実装します インジケータは再描画またはバックペインティングではありません Swing Tradingとは Swing Tradingは
    もちろんです。以下は、提供いただいたテキストの日本語への翻訳です: MT4用の天文学指標をご紹介します:究極の天体トレーディングコンパニオン トレーディング体験を天空の高みに高める準備はできていますか?私たちの革命的なMT4用の天文学指標をご紹介します。この革新的なツールは、複雑なアルゴリズムの力を借りて、類まれなる天文学的洞察と精密な計算を提供します。 あなたの指先で宇宙の情報を:   宝のような天文学的データが明らかになる包括的なパネルをご覧ください。惑星の地理的/太陽中心座標、太陽と地球の距離、星の大きさ、伸び、星座、黄道座標および赤道座標、さらには水平座標まで、それぞれが綿密に計算され美しく表示されています。指標によって生成される垂直線は時間値に対応し、トレーディングの旅に宇宙の視点を提供します。 惑星のラインと関係:   グラフを飾る惑星のラインの魔法を体験し、スケールと角度をカスタマイズできます。直感的なコントロールパネルを介して各惑星のラインの表示を簡単に切り替えることができます。指定された時刻範囲内での合会、六分会、四分会、三分会、対会、逆行の指標で天体の関係の芸術を発
    Quantum Trend Sniper
    Bogdan Ion Puscasu
    4.73 (51)
    ご紹介   クォンタム トレンド スナイパー インジケーターは 、トレンド反転を特定して取引する方法を変革する画期的な MQL5 インジケーターです。 13年以上の取引経験を持つ経験豊富なトレーダーのチームによって開発されました。     クォンタムトレンドスナイパーインジケーター   は、非常に高い精度でトレンドの反転を識別する革新的な方法で、あなたのトレーディングの旅を新たな高みに押し上げるように設計されています。 ***Quantum Trend Sniper Indicatorを購入すると、Quantum Breakout Indicatorを無料で入手できます!*** クォンタム ブレイクアウト インジケーターは、トレンドの反転を特定するとアラートを発し、矢印を示し、3 つのテイクプロフィットレベルを提案します。 初心者トレーダーにもプロのトレーダーにも適しています。 量子EAチャネル:       ここをクリック MT4のバージョン:       ここをクリック 推奨事項: 期間:すべての時間枠。最良の結果を得るには、M15、M30、H1 のタイムフ
    作者のその他のプロダクト
    Gartley Hunter Multi - An indicator for searching for harmonic patterns simultaneously on dozens of trading instruments and on all possible timeframes. Manual (Be sure to read before purchasing) | Version for MT4 Advantages 1. Patterns: Gartley, Butterfly, Shark, Crab. Bat, Alternate Bat, Deep Crab, Cypher 2. Simultaneous search for patterns on dozens of trading instruments and on all possible timeframes 3. Search for patterns of all possible sizes. From the smallest to the largest 4. All fou
    Bill Williams Advanced is designed for automatic chart analysis using Bill Williams' "Profitunity" system. The indicator analyzes four timeframes at once. Manual (Be sure to read before purchasing) Advantages 1. Automatically analyzes the chart using the "Profitunity" system of Bill Williams. The found signals are placed in a table in the corner of the screen. 2. Equipped with a trend filter based on the Alligator indicator. Most of the system signals are recommended to be used only according t
    Elliott Wave Helper
    Siarhei Vashchylka
    4.92 (13)
    Elliott Wave Helper - a panel for making elliott wave and technical analysis. Includes all known wave patterns, support and resistance levels, trend lines and cluster zones. Manual (Be sure to read before purchasing) | Version for MT4 Advantages 1. Making wave analysis and technical analysis in a few clicks 2. All Elliott wave patterns available, including triangle and combinations 3. All nine wave display styles, including a special circle font 4. E lements of technical analysis : trend lines,
    Trading History - A program for trading and money management on the history of quotes in stratagy tester. It can work with pending and immediate orders, and is equipped with trailing stop, breakeven and take profit functions. Very good for training and testing different strategies. Manual (Be sure to read before purchasing) Advantages 1. Allows you to test any trading strategy in the shortest possible time 2. An excellent simulator for trading training. You can gain months of trading experience
    Trader Evolution
    Siarhei Vashchylka
    5 (5)
    " Trader Evolution " - A utility designed for traders who use wave and technical analysis in their work. One tab of the utility is capable of money management and opening orders, and the other can help in making Elliott wave and technical analysis. Manual (Be sure to read before purchasing) | Version for MT4 Advantages 1. Trading in a few clicks. Immediate and pending orders are available in the panel 2. Money management. The program automatically selects the appropriate lot size 3. Simplifies
    Gartley Hunter - An indicator for searching for harmonic patterns (Gartley patterns) and their projections. The indicator is equipped with a system of alerts and push notifications. Manual (Be sure to read before purchasing) | Version for MT4 Advantages 1. 12 harmonic patterns: 7 classical and 5 exotic. New patterns will be added as the indicator develops. 2. Constant automatic search for harmonic patterns. The indicator is capable of finding from the smallest to the largest patterns. 3. Automa
    The Price Action Finder Multi indicator is an indicator of entry points that searches for and displays Price Action system patterns on dozens of trading instruments and on all standard time frames: (m1, m5, m15, m30, H1, H4, D1, Wk, Mn). The indicator places the found patterns in a table at the bottom of the screen. By clicking on the pattern names in the table, you can move to the chart where this pattern is located. Manual (Be sure to read before purchasing) | Version for MT4 Advantages 1. Pat
    Pure View
    Siarhei Vashchylka
    5 (1)
    The " Pure View " indicator is designed to quickly display and hide indicators on the chart. Description 1. Currently Pure View works with Stochastic, MACD, RSI indicators 2. Displaying and hiding indicators occurs using hot keys 3. The key combination Shift + C will display or hide the "Stochastic" indicator on the chart 4. The key combination Shift + V will display or hide the "RSI" indicator on the chart 5. The key combination Shift + B will display or hide the "MACD" indicator on the chart A
    FREE
    The Price Action Finder indicator is an indicator of entry points, which is designed to search and display patterns of the Price Action system on a price chart. The indicator is equipped with a system of trend filters, as well as a system of alerts and push notifications. Manual (Be sure to read before purchasing) | Version for MT5 Advantages 1. Patterns: Pin bar, Outside bar, Inside bar, PPR, Power bar, Hanging man, Inverted hammer 2. Pattern filtering system. Removes countertrend patterns from
    Elliott Wave Helper - a panel for making elliott wave and technical analysis. Includes all known wave patterns, support and resistance levels, trend lines and cluster zones. Manual (Be sure to read before purchasing) | Version for MT5 Advantages 1. Making wave analysis and technical analysis in a few clicks 2. All Elliott wave patterns available, including triangle and combinations 3. All nine wave display styles, including a special circle font 4. E lements of technical analysis : trend lines,
    Trading Helper - Program for trading and money management. It works with pending and immediate orders, and is equipped with trailing stop, breakeven and take profit functions. Manual (Be sure to read before purchasing) Advantages 1. Comfortable trading in a few clicks. Immediate and pending orders are available in the panel 2. Fixed percent method. The panel can select the lot size based on a predetermined risk 3. Trading with a fixed lot. In a few clicks, select a lot and open a Trade 4. Posi
    " Trader Evolution " - A utility designed for traders who use wave and technical analysis in their work. One tab of the utility is capable of money management and opening orders, and the other can help in making Elliott wave and technical analysis. Manual (Be sure to read before purchasing) | Version for MT5 Advantages 1. Trading in a few clicks. Immediate and pending orders are available in the panel 2. Money management. The program automatically selects the appropriate lot size 3. Simplifies
    Gartley Hunter MT4
    Siarhei Vashchylka
    3.67 (3)
    Gartley Hunter - An indicator for searching for harmonic patterns (Gartley patterns) and their projections. The indicator is equipped with a system of alerts and push notifications. Manual (Be sure to read before purchasing) | Version for MT5 Advantages 1. 12 harmonic patterns: 7 classical and 5 exotic. New patterns will be added as the indicator develops. 2. Constant automatic search for harmonic patterns. The indicator is capable of finding from the smallest to the largest patterns. 3. Automa
    The " Stochastic Advanced " indicator displays the signals of the 'Stochastic" indicator directly on the chart without the presence of the indicator itself at the bottom of the screen. The indicator signals can be displayed not only on the current timeframe, but also on a timeframe one level higher. In addition, we have implemented a filter system based on the Moving Average indicator. Manual (Be sure to read before purchasing) | Version for MT5 Advantages 1. Displaying the signals of the "Stoch
    Gartley Hunter Multi - An indicator for searching for harmonic patterns simultaneously on dozens of trading instruments and on all classic timeframes: (m1, m5, m15, m30, H1, H4, D1, Wk, Mn). Manual (Be sure to read before purchasing) | Version for MT5 Advantages 1. Patterns: Gartley, Butterfly, Shark, Crab. Bat, Alternate Bat, Deep Crab, Cypher 2. Simultaneous search for patterns on dozens of trading instruments and on all classic timeframes 3. Search for patterns of all possible sizes. From t
    The Price Action Finder Multi indicator is an indicator of entry points that searches for and displays Price Action system patterns on dozens of trading instruments and on all standard time frames: (m1, m5, m15, m30, H1, H4, D1, Wk, Mn). The indicator places the found patterns in a table at the bottom of the screen. By clicking on the pattern names in the table, you can move to the chart where this pattern is located. Manual (Be sure to read before purchasing) | Version for MT5 Advantages 1. Pat
    Fractal Advanced - displays Fractal and Alligator indicators on the price chart. Has wide options for settings and customization. It is also equipped with alerts and a hotkey system. Manual (Be sure to read before purchasing) | Version for MT 5 Advantages 1. The indicator does not fill the entire chart with fractals, but allows you to display only relevant signals. 2. The number of fractals is adjusted by scrolling the mouse while holding down the Shift key. 3. Instantly show/hide the Alligator
    The Price Action Finder indicator is an indicator of entry points, which is designed to search and display patterns of the Price Action system on a price chart. The indicator is equipped with a system of trend filters, as well as a system of alerts and push notifications. Manual (Be sure to read before purchasing) | Version for MT4 Advantages 1. Patterns: Pin bar, Outside bar, Inside bar, PPR, Power bar, Hanging man, Inverted hammer 2. Pattern filtering system. Removes countertrend patterns from
    Fractal Advanced - displays Fractal and Alligator indicators on the price chart. Has wide options for settings and customization. It is also equipped with alerts and a hotkey system. Manual (Be sure to read before purchasing) | Version for MT4 Advantages 1. The indicator does not fill the entire chart with fractals, but allows you to display only relevant signals. 2. The number of fractals is adjusted by scrolling the mouse while holding down the Shift key. 3. Instantly show/hide the Alligator
    フィルタ:
    Kai2905
    66
    Kai2905 2022.08.25 16:02 
     

    ユーザーは評価に対して何もコメントを残しませんでした

    レビューに返信
    バージョン 1.2 2023.11.03
    Changed external default parameters
    バージョン 1.1 2022.06.03
    Added periods of the Stochastic indicator