POscillator
- インディケータ
- Arya Tavakol
- バージョン: 1.7
- アップデート済み: 8 8月 2023
The most sensitive indicator you've ever seen . . .
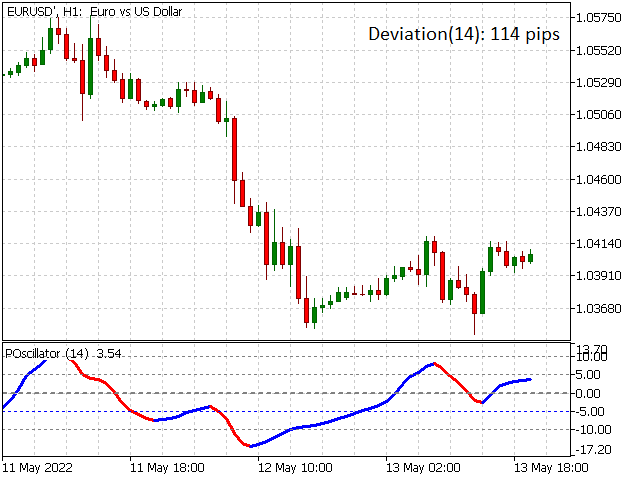
POscillator is a sensitive indicator to find each trend direction change in every timeframe. It shows price variations and reveals up or down trends. POscillator makes a price curve based on frequency filters. The procedure makes two price functions by using high-frequency and low-frequency filters separately. Then it adds them together to create a smoothed price curve. The final stage of the indicator converts this smoothed curve to an oscillator by calculating its standard variable and multiplies to 5 to make it oscillate around -10 to 10. POscillator also calculates the deviation of price variations for the selected period in pips unit.
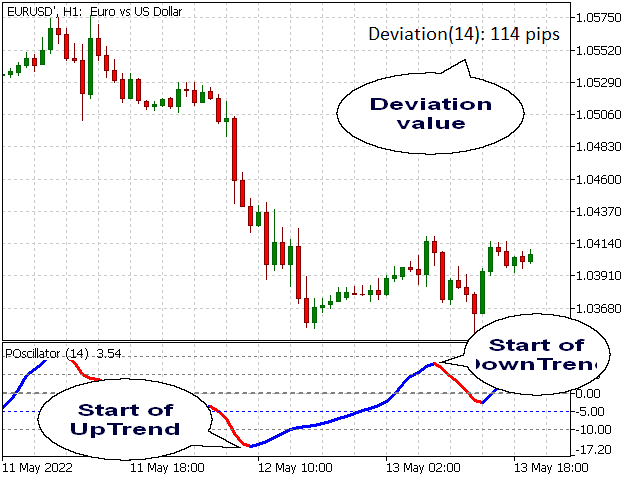
The indicator has two different colors for uptrend and downtrend. Therefore, all trends are separated from each other and we can use it to do trend trading simply. Each trend begins with a color change and continues until the next color change based on the selected timeframe.
It mainly oscillates between -10 to +10. The indicator value of -10 shows overbought and +10 shows oversold conditions. When the indicator crosses one of these lines, we expect a trend change and we can open a limit order and wait to reach the limit price. Deviation value in pips helps us to select the best stop loss value as it shows half of the volatility of price in the last period bars.
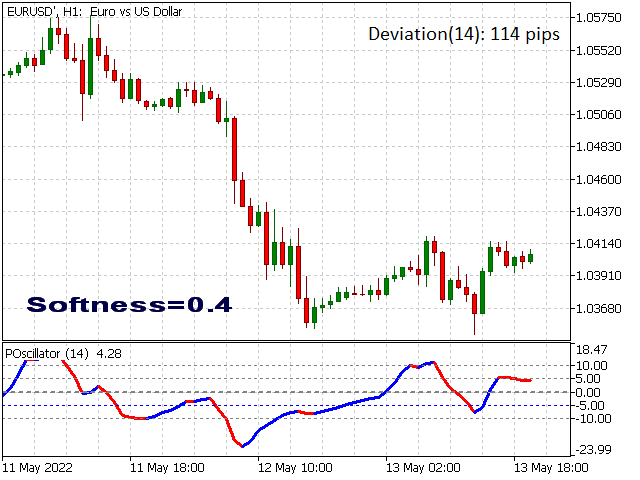
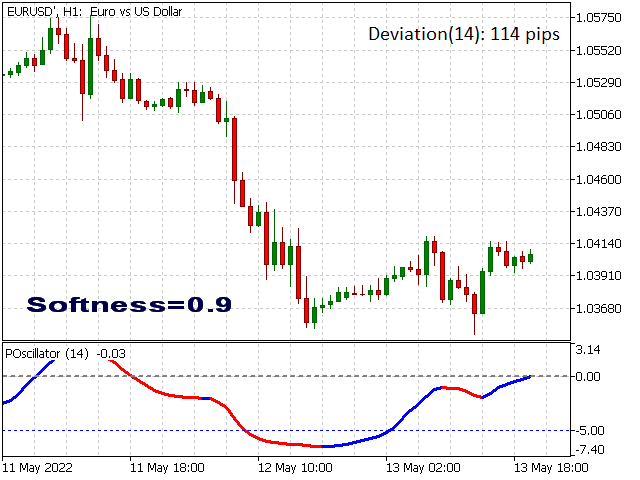
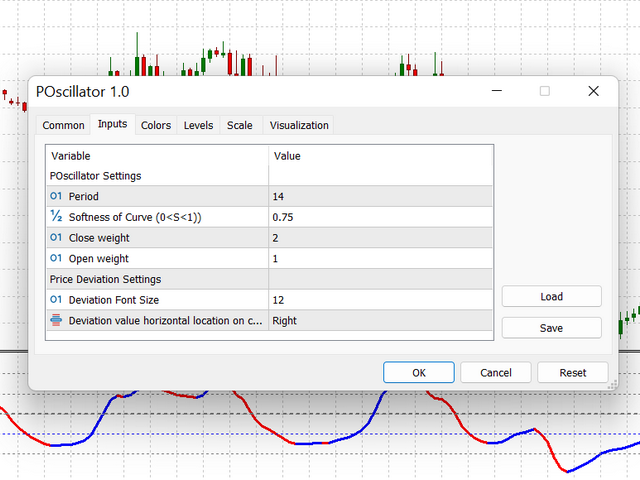
There are six input parameters; period, Softness, closeX and openX as Oscillator settings and Deviation value fontsize and location . With a higher value of Softness, the indicator ignores little price changes and low trends. Therefore, the indicator stays at its state longer as an uptrend or downtrend. Open and Close weight factors are used to change price curve form based on the priority of Open or Close price.
Trading Strategy
Trading with POscillator indicator is simple. It becomes parallel to the time axis before a trend direction change. It's an alarm to close the position. However, you can use two separate indicator windows with different periods, one fast and one slow (for example 11 and 33). The slow period indicator assures you about a trend existence in the near future. When the slow period shows a powerful trend, it's better to wait until a new trend is reached with the same direction as a powerful one. In powerful trend, modification waves are small and not worth to open a new position.
When using two separate indicators at the same time, keep in mind that you have to select different H_Align for each indicator. Deviations of slow and fast periods are more useful. Compare fast period deviation with slow ones. Bigger value of fast period shows a sudden and sharp trend. Small deviation represents consolidation and quiet condition of market. It's safer to trade in low volatility conditions.
Note: Less Softness, more sensitivity! For softness greater than 0.4, you may have one bar lag. Check the lag first.
Input Parameters:
| POscillator Settings: | |
| Period | Number of bars for calculation |
| Softness | Softness of Indicator 1<S<10 |
| closeX | Close weight |
| openX | Open weight |
| Font Settings: | |
| fontsize | Deviation Font Size |
| Xloc | Horizontal Location |
| Yloc | Vertical Location |
| H_Align | Deviation value horizontal location on chart screen |

