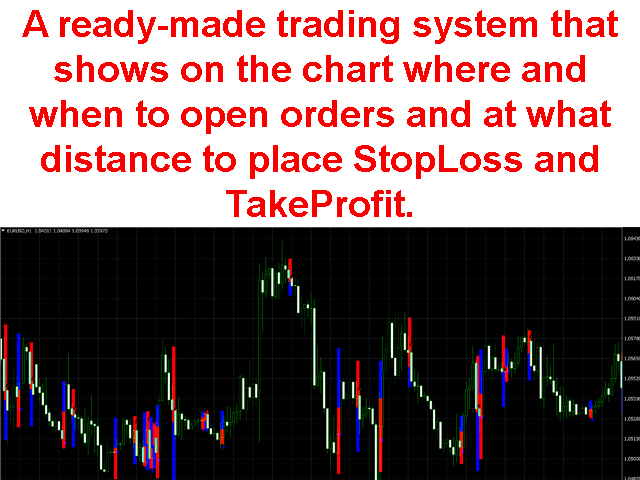
Ready trading system
- インディケータ
- Andrey Kozak
- バージョン: 1.0
- アクティベーション: 20
Ready trading system. The indicator arrow shows when and in what direction you need to open an order. At the end of the blue rectangle we put TakeProfit, and at the end of the red rectangle we put StopLoss. The indicator calculates the size of TakeProfit and StopLoss automatically, depending on the market volatility and the probability of price direction. Therefore, the indicator does all the work instead of the trader. He analyzes the market himself, determines the distance for TakeProfit and StopLoss.
According to the results of our analyzes, 90% of signals are closed by TakeProfit.
Benefits of the indicator:
- this is a ready trading system
- trades with a scalping system
- recommended timeframes M5, M15, H1
- recommended currency pairs GBPUSD, EURUSD, AUDUSD, USDJPY, EURJPY, XAUUSD (GOLD).
Indicator settings:
- period - indicator calculation period. Adjusts the accuracy and frequency of the signals.
- stops - coefficient of distance to TakeProfit and StopLoss.