Imbalance Finder for SMC MT4
- インディケータ
- Jhoniel Viloria
- バージョン: 5.2
- アップデート済み: 1 10月 2023
- アクティベーション: 15
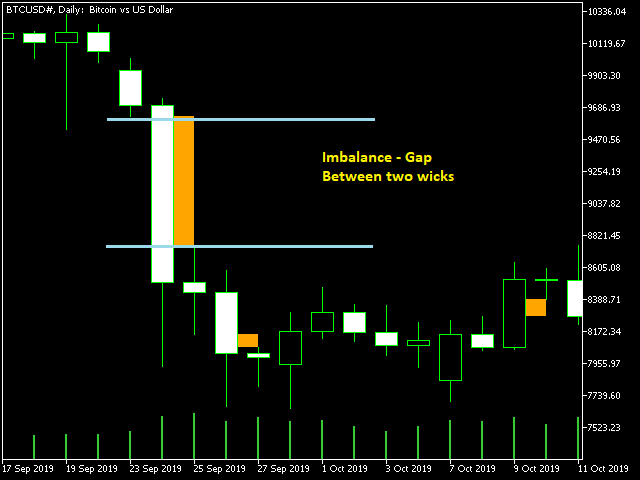
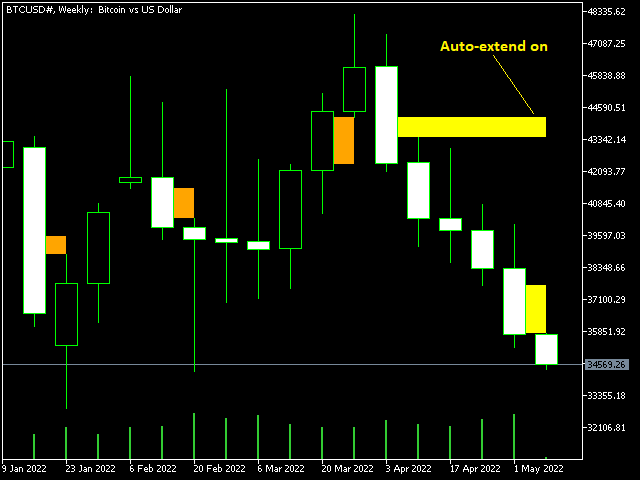
Imbalance / Fair Value Gap (FVG), this is a zone / gap created when the price move with force in a given direction. It identify a zone where the price could
potentially go back. This gives perfect targets for your trades.Imbalance is created from the high and low of 3 candles. When the wicks the of 1st and 3rd candle does not fully overlap the middle one.
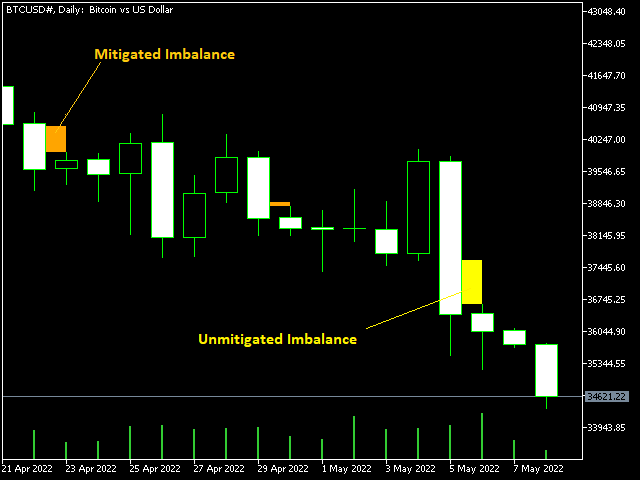
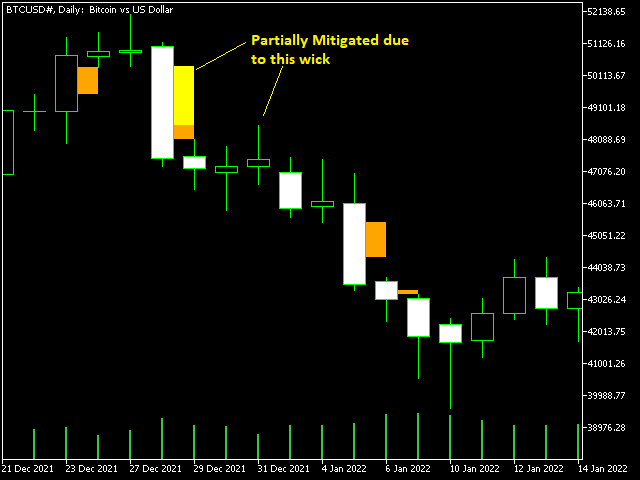
This indicator will help you to easily spot mitigated/unmitigated imbalances in your chart.
NEW FEATURE Update:
- Multi-TimeFrame Feature

Looks good so far, 5 stars for now!