PZ Mean Reversion MT5
- インディケータ
- PZ TRADING SLU
- バージョン: 3.0
- アップデート済み: 19 7月 2024
- アクティベーション: 20
回帰取引を意味する専門的かつ定量的なアプローチを実装する独自の指標。これは、価格が予測可能かつ測定可能な方法で迂回して平均に戻るという事実を利用しており、非定量的な取引戦略を大幅に上回る明確な出入りルールを可能にします。
[ Installation Guide | Update Guide | Troubleshooting | FAQ | All Products ]
- 明確な取引シグナル
- 驚くほど簡単に取引できます
- カスタマイズ可能な色とサイズ
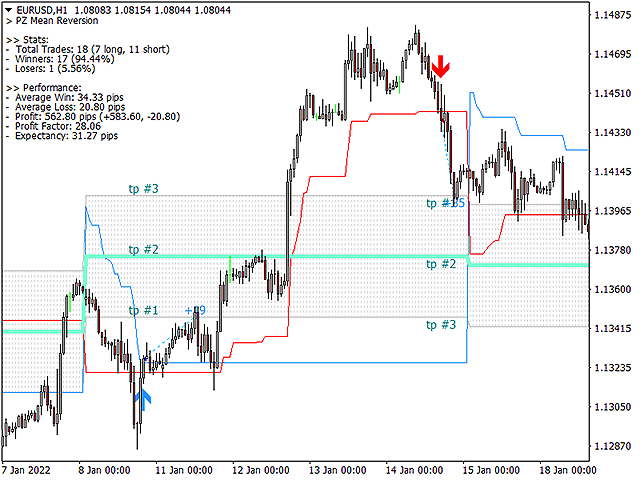
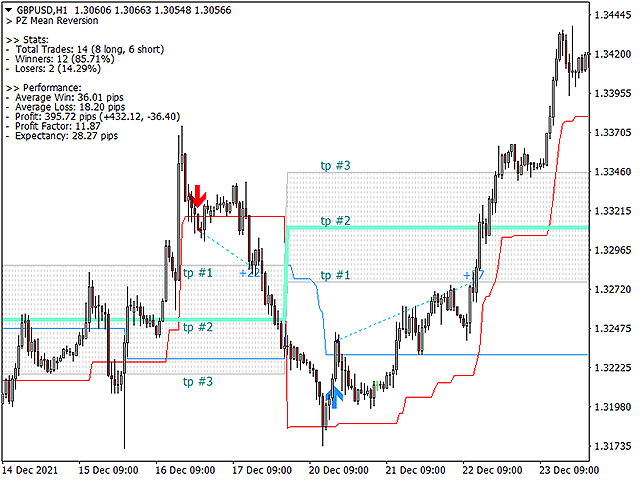
- パフォーマンス統計を実装します
- ほとんどの取引戦略を上回ります
- 適切なSLおよびTPレベルを表示します
- 電子メール/音声/視覚アラートを実装します
使い方
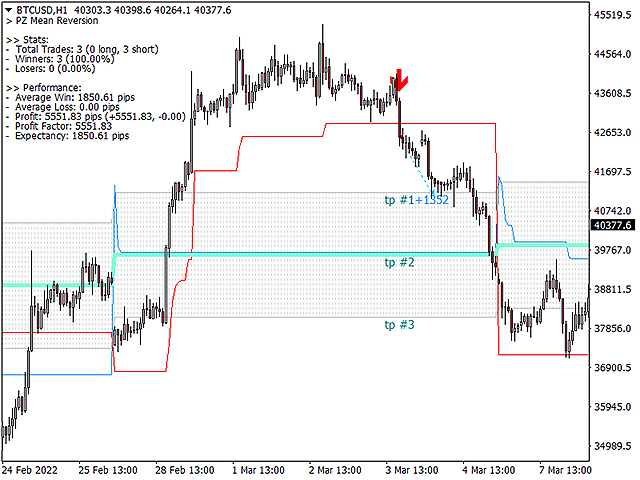
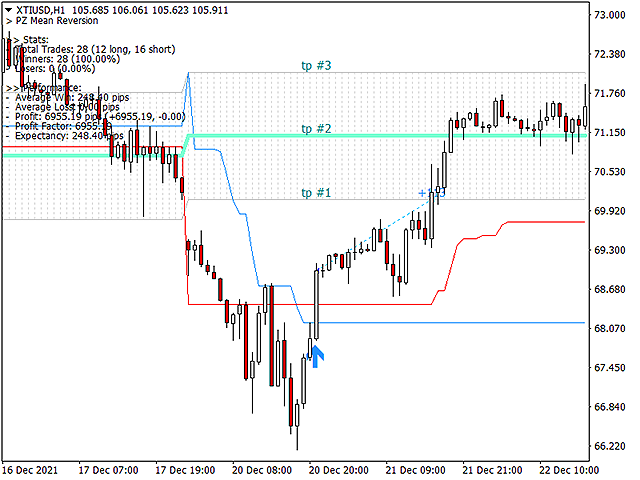
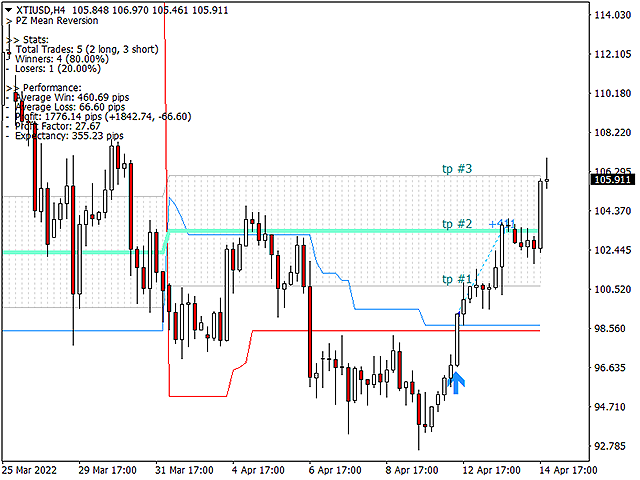
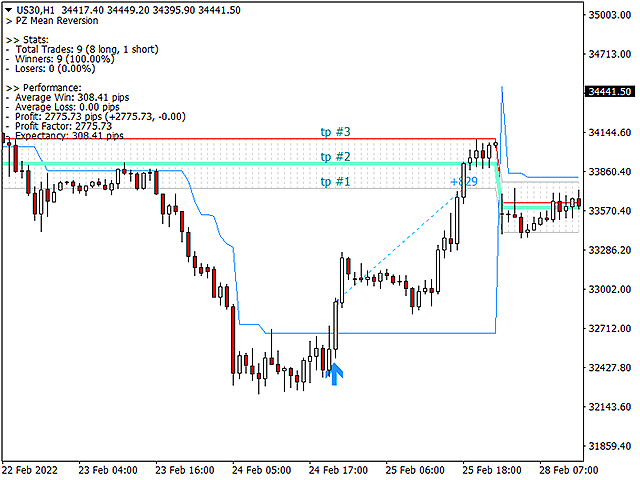
インディケータは、より高い時間枠からの完全にカスタマイズ可能な移動平均の周りの標準偏差を測定し、トレンドフォローアプローチを使用して正確に取引を見つけます。取引は、現在のチャートの価格アクションに飛び込むことによって見つけられ、価格が選択したより高い時間枠から計算された平均価格帯に戻ったときに閉じられます。それがコード化される方法のために、指標は高ボラティリティと強いトレンドの市場から離れて、平均への復帰が許容可能なボラティリティ対方向性の比率の中で実行可能である予測可能なシナリオのみを取引します。
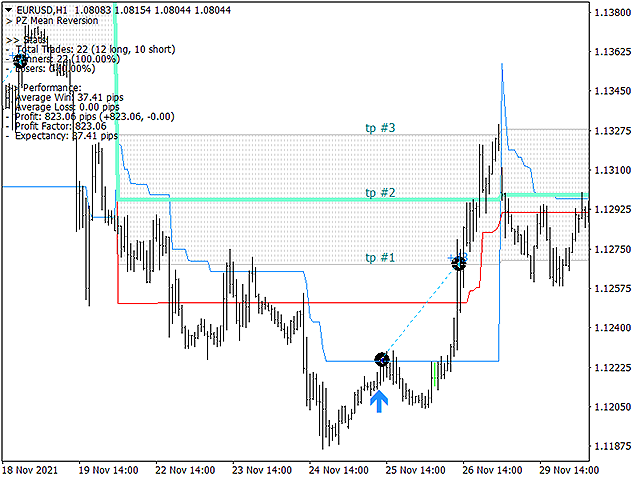
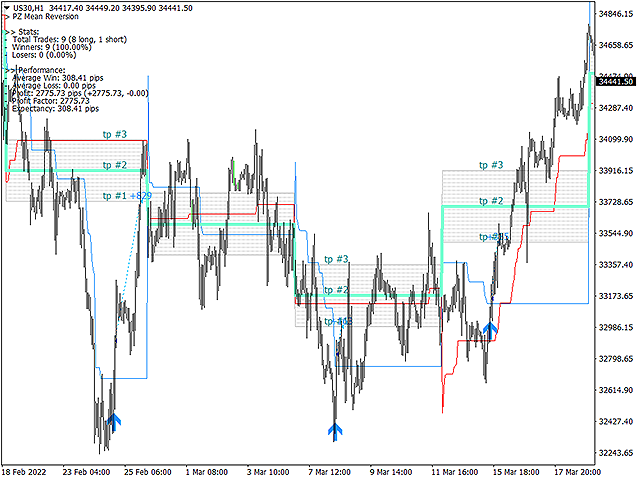
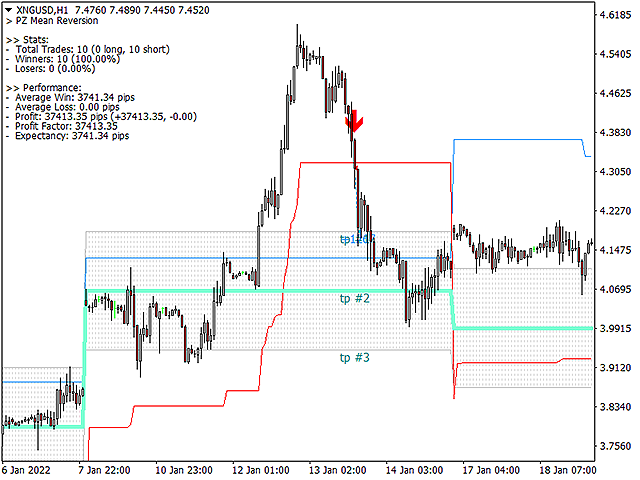
インジケーターの構造
- 緑の線は、より高い時間枠(別名平均)からの移動平均です。
- 点線の領域は移動平均の周りの典型的な価格帯です
- 青い線は強気な取引のブレイクアウト価格です
- 赤い線は弱気な取引のブレイクアウト価格です
取引は平均に対して行われ、典型的な価格帯の範囲内で閉じられます。
何を取引するか
平均回帰は、事実上すべての市場で常に行われています。
- 外国為替ペア
- 株価指数
- 貴金属
- 商品
- 暗号通貨
- 債券
推奨される時間枠
- MN1移動平均を伴うH4
- H1とW1移動平均
- D1移動平均のM15
- M1とH4移動平均
入力パラメータ
インジケーターのすべての入力パラメーターの詳細については、 ここをクリックしてください。
著者
ArturoLópezPérez、個人投資家および投機家、ソフトウェアエンジニア、PZTradingSolutionsの創設者。 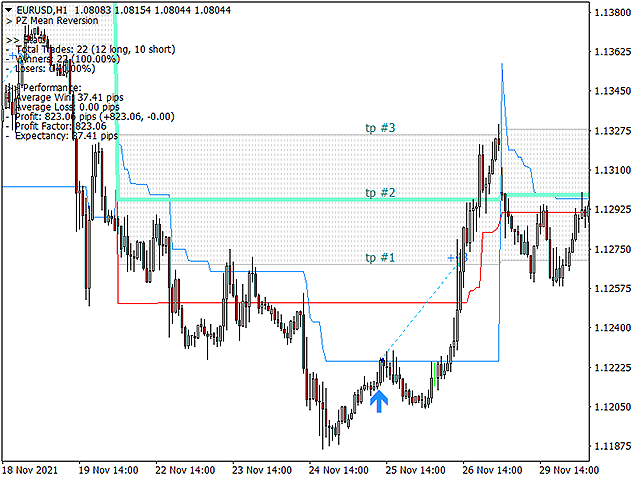

All in one indicator, with this indicator I know where the entry, where the TP and SL. The price exactly respect the line and mean area.. Good indicator, I love it..
The Bug was not a problem anymore when I switch my VPS from using Windows 7 OS to Windows 10 OS, it's fine now..