Rainbow Ribbon
- インディケータ
- Pierce Vallieres
- バージョン: 1.0
- アクティベーション: 20
Rainbow Ribbon
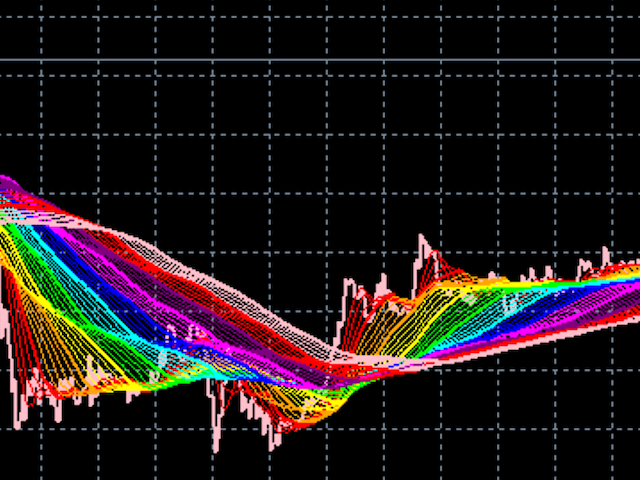
- Rainbow MA bands
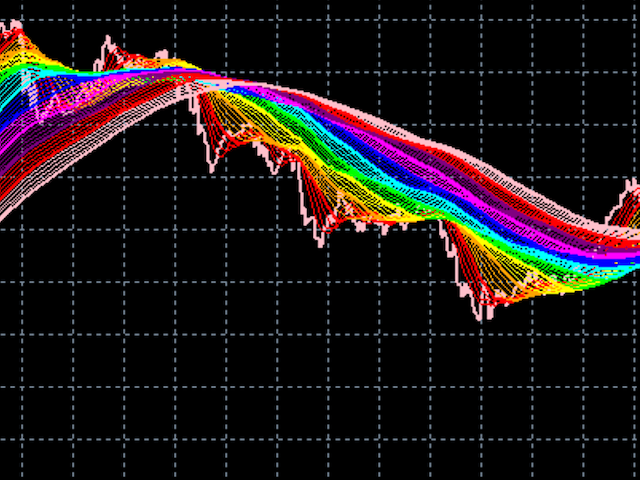
- Useful for spotting trend changes
- Useful for spotting trend slopes
- Useful for spotting trend acceleration
- Ability to choose ribbon colors, moving averages, and distances
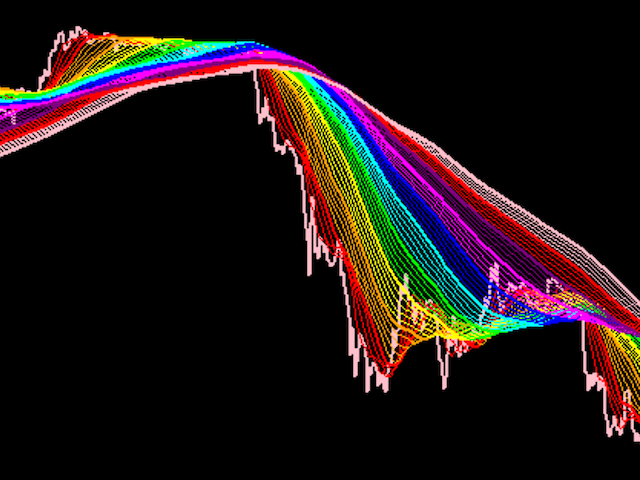
- Provides colorful rainbow ribbons to show an array of moving averages
Rainbow Ribbon is an extremely useful indicator, it has been designed to make it easy to spot the trend and also changes within the trend before they occur. It can be used many different ways and provides the ability to customize its look and feel.