KT Trend Wave MT4
- インディケータ
- KEENBASE SOFTWARE SOLUTIONS
- バージョン: 1.1
- アクティベーション: 5
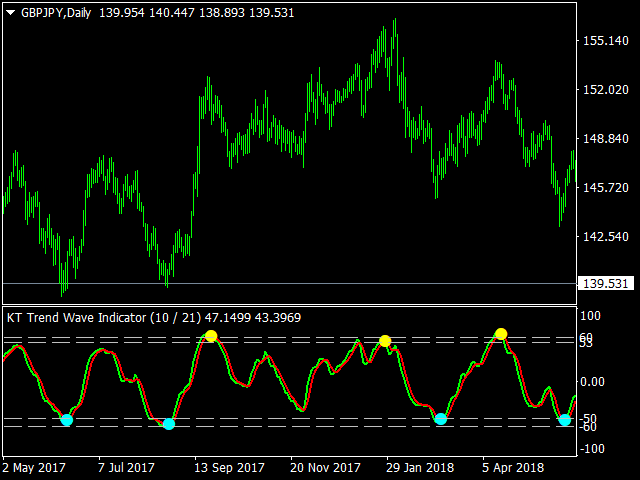
KT Trend Wave is an oscillator based on the combination of Price, Exponential, and Simple moving averages. It usually works great to catch the short term price reversals during the ongoing trending market.
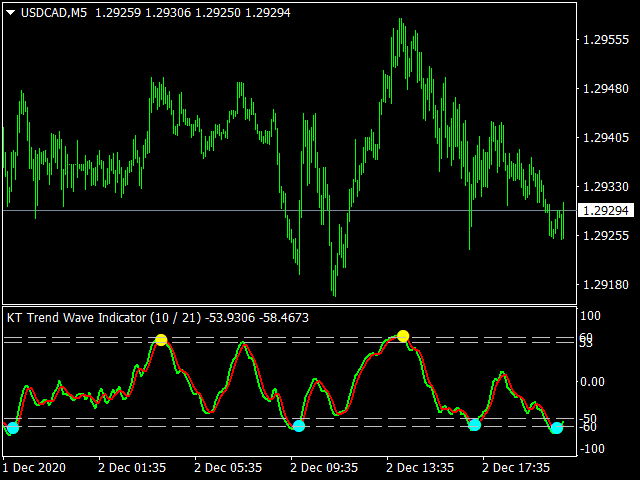
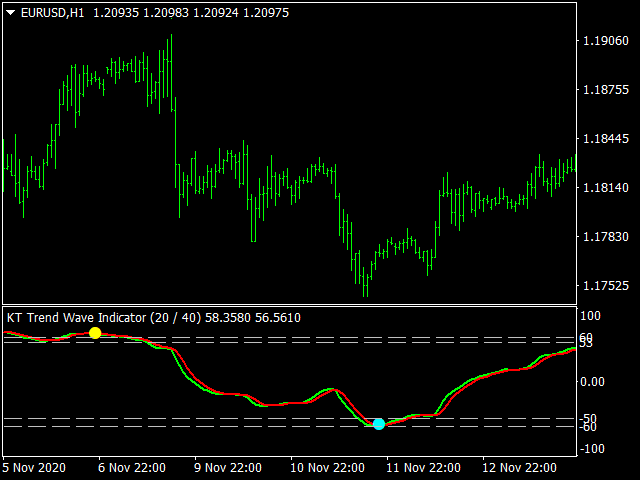
The bullish and bearish crossovers of the main and signal lines can be used as buy/sell signals (blue and yellow dot). It can also be used to find the overbought and oversold market. The buy and sell signals that appear within the overbought and oversold region are usually stronger.
Features
- Unlike the other OBOS oscillators, this indicator works well on the smaller time-frames.
- During the consolidation phase in the market, it can detect the reversals with greater accuracy.
- It helps to plan the exits using crystal clear overbought/oversold analysis.
- All Metatrader alerts included.
Inputs
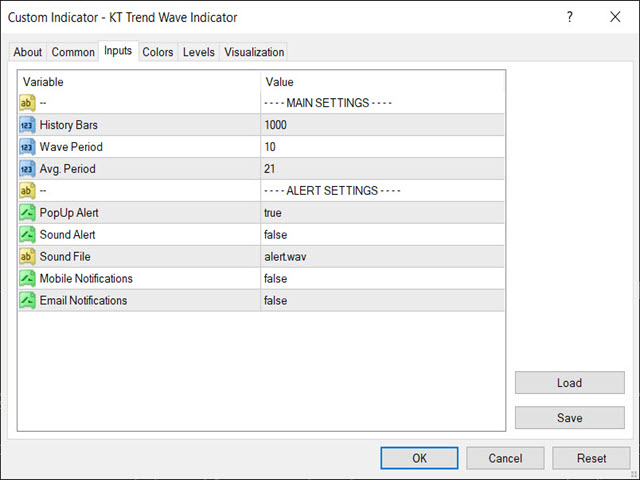
- History Bars: Number of historical bars to use in the indicator's calculation.
- Wave Period: The period to calculate the trend wave main line.
- Avg. Period: This is the smoothing period applied to the trend wave mainline. The shorter is the value, the more the signals generated by the indicator.
Advantages
Unlike the other lagging oscillators, KT Trend Wave is a leading indicator that detects the reversals more accurately. More importantly, the crossover signals never repaint and work great during the choppy market.
