KT Custom High Low MT4
- インディケータ
- KEENBASE SOFTWARE SOLUTIONS
- バージョン: 1.10
- アクティベーション: 5
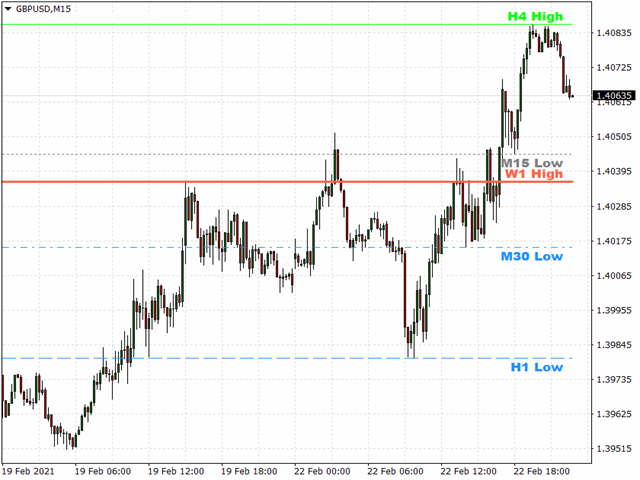
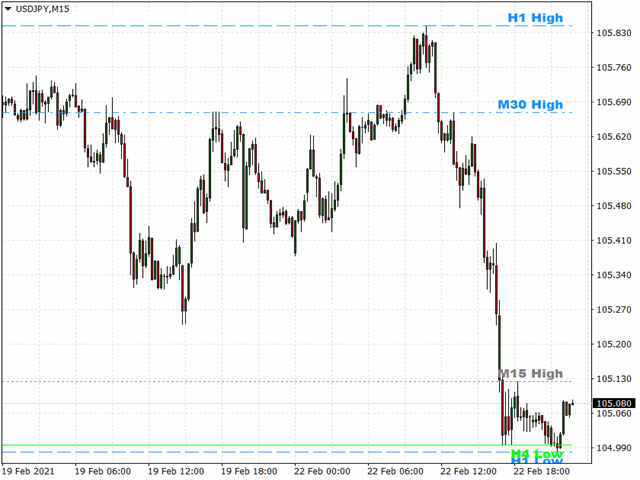
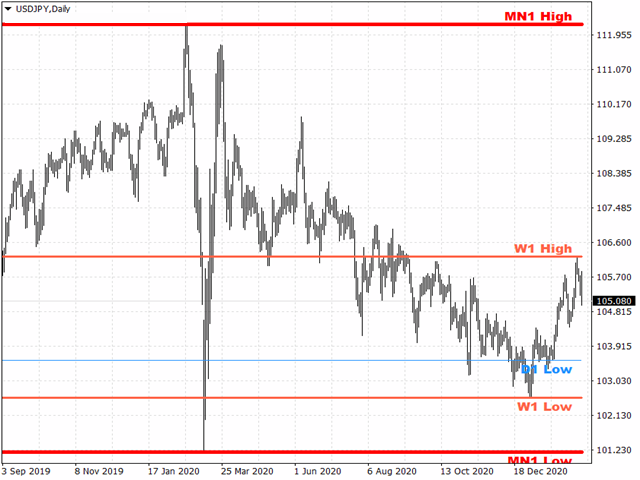
KT Custom High Low shows the most recent highs/lows by fetching the data points from multi-timeframes and then projecting them on a single chart. If two or more highs/lows are found at the same price, they are merged into a single level to declutter the charts.
Features
- It is built with a sorting algorithm that declutters the charts by merging the duplicate values into a single value.
- Get Highs/Lows from multiple timeframes on a single chart without any fuss.
- Provide alerts when the current price touches a high or low.
- Marks every high/low with their respective timeframe.
- Fully customizable - You can adjust the period, colors, width, and font size according to your convenience.
Inputs
- HL Period: period to find the highs/lows.
- Font Size: Font size for the labels.
- Select the time-frames to find the respective highs and lows.
What Exactly does High/Low indicate?
The Highs/Lows can indicate potential support/resistance levels that help to speculate a reversal in advance. Moreover, higher highs and higher lows indicate an uptrend, while lower lows and lower highs indicates a downtrend in the market.
