Infinity Oscillator Indicator
- インディケータ
- Elias Mtwenge
- バージョン: 1.0
- アクティベーション: 20
Note: The price is subject to increase at any time from now!
Hi Traders, I would like to introduce to you my new indicator called the Infinity Oscillator Indicator.
This indicator is designed for both newbies and professional traders.
Parameters
- The inputs that can be changed by the user are colors of the lines only so as to not disturb the original trading strategy this indicator uses.
- The indicator will not provide buy and sell arrow signals but will help traders in market analysis approach for them selves so as to filter the wrong signals.
This indicator is designed to help traders forecast the following
1. The direction of the trend
2. The Overbought and Oversold zones
3. Bullish zones
4. Bearish zones
5. Extreme zones (Overbought/Oversold zones)
How to use the indicator.
A. When the signal line is between the top blue line and the light blue line
1. The light blue line may act as strong support
2. The blue line may act as strong resistance line.
B. When signal line is below the light blue line and the pink line
1. The pink line may act as support
2. The light blue line may act as resistance
C. When signal line is between the pink line and the yellow line
1. The pink line may act as a resistance line
2. The yellow line may act as a support line.
D. When signal line is between the yellow line and the green line
1. The yellow line may act as a strong resistance
2. The green line may act as a strong support line.
Generally,
E. When signal line is above the pink line we say that the security is in a bullish trend.
F. When the signal line is below the pink line we say the security is in a bearish trend.
G. When the signal line is above the light blue line we say that the security is in a strong bullish phase or overbought then look for buying more or reverse signal to the down side.
H. When the signal line is below the yellow line we say that the security is in a strong bearish phase or oversold then look for selling more or reverse signal to the upward side.
Last words
I have attached the screen shot so that you see what exactly the indicator looks like on the chart.
Disclaimer: Not every signal will be correct! Signals generated by this tool should not be considered as the final to making financial decisions. You may lose your valuable capital if not making wise decisions! You are responsible for your trading decisions and actions! Thank you for working with my tools wisely.

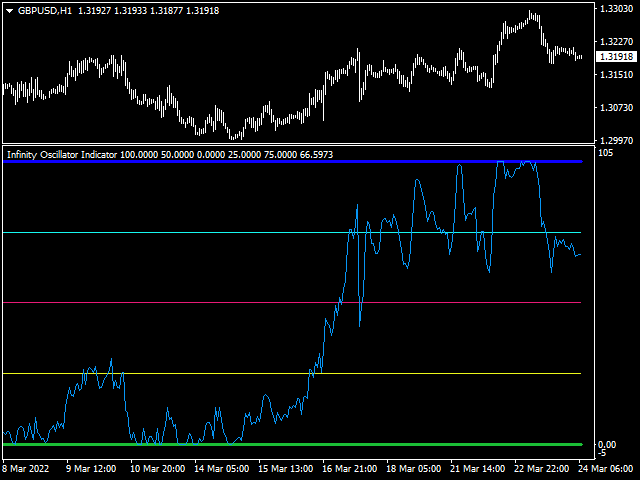

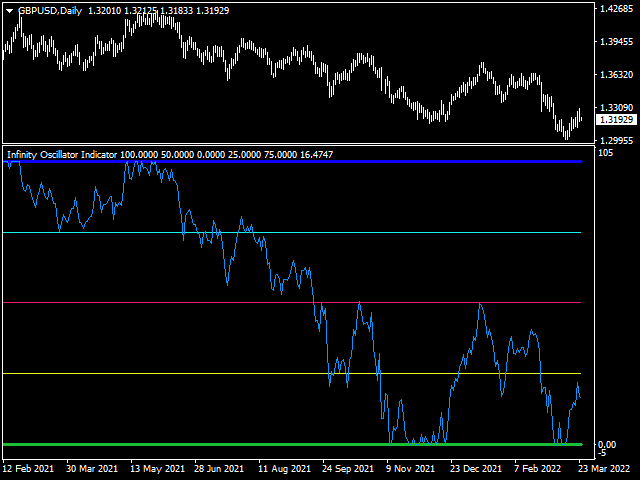
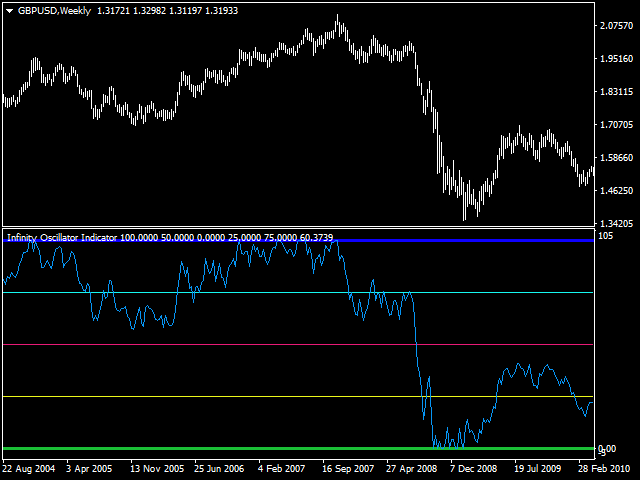
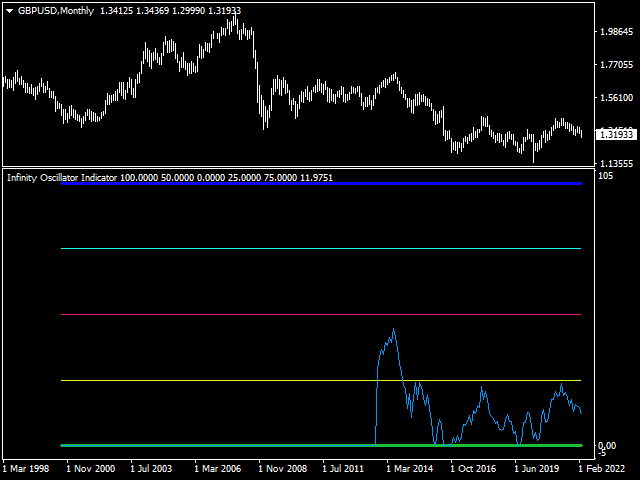



















Cet indicateur est un outil très intéressant pour les commerçants qui ne veulent rien rater des tendances. Les niveaux intermédiaires de l'indicateur sont généralement des zones de consolidation où vous pouvez prendre une partie de vos gains avant de retourner dans la tendance. Quitter la tendance lorsque le niveau extrême est atteint. Combinez cet indicateur avec d’autres indicateurs de l’auteur "Elias Mtwenge" et vous aurez des signaux assez précis.