Hunttern ZigZag MT5
- インディケータ
- Hassan Gh Fakhraei
- バージョン: 1.0
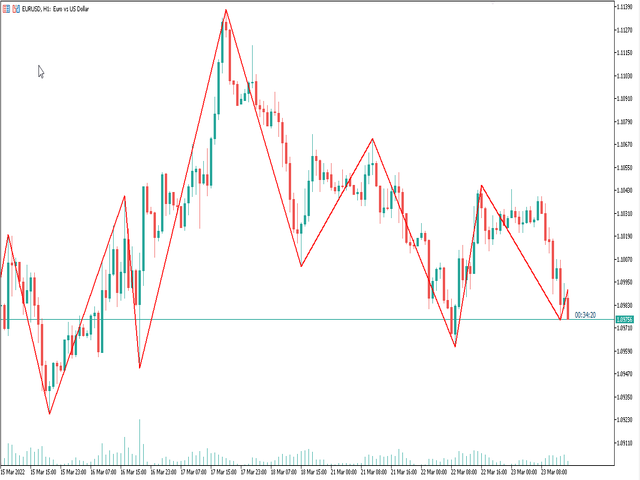
Hunt markets with Hunttern ZigZag. Easy to use with one parameter
You can use it for the following:
-Classic patterns
-Heads and shoulders
-Harmonic patterns
-Elliott Wave
-Support and resistance
-Supply and Demand
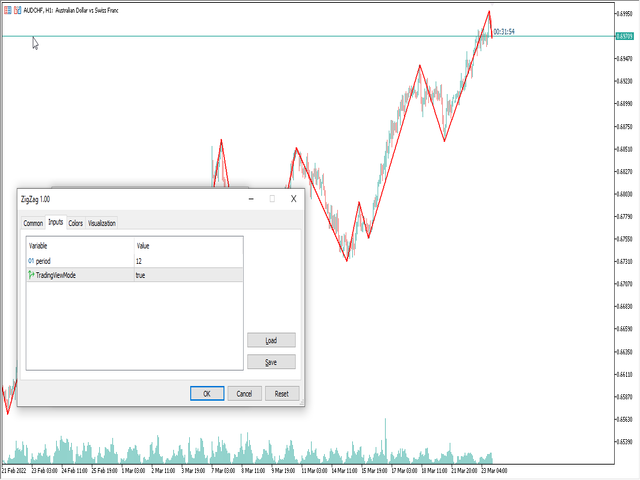
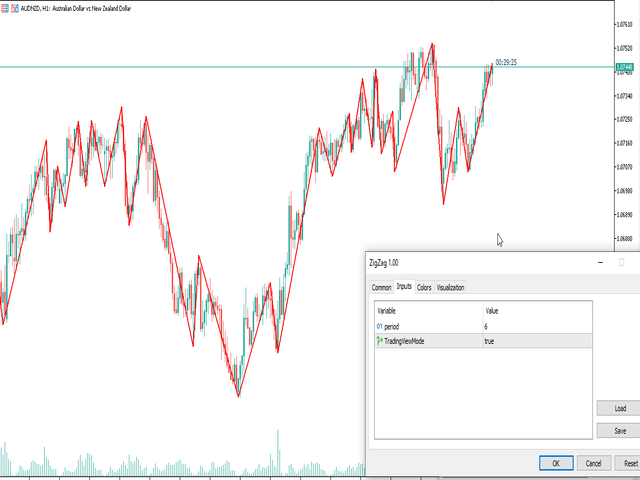
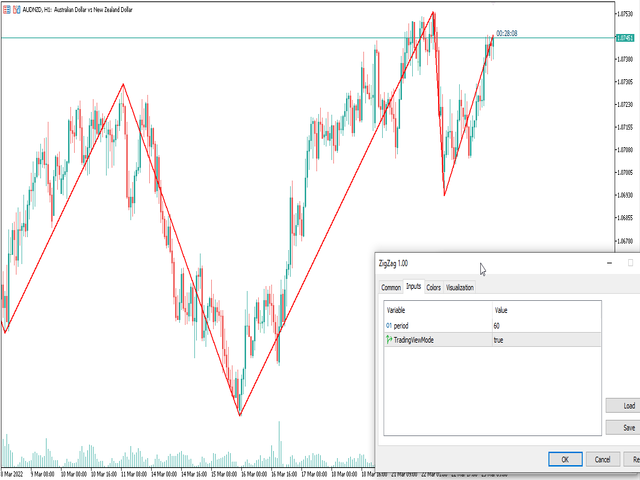
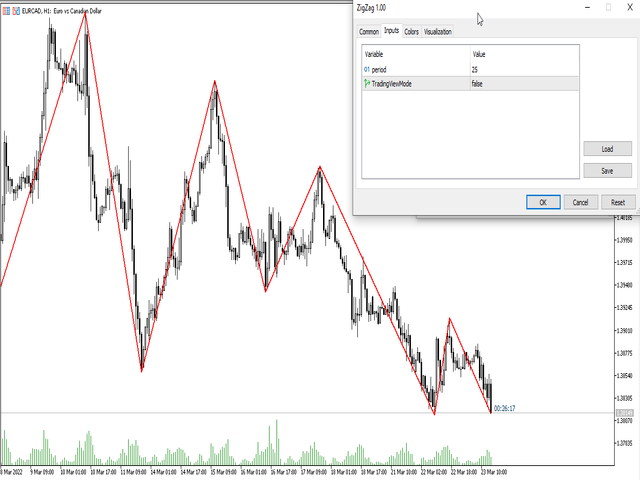
Single parameter:
-Period (1-120)
Features:
-Candle time
-Single parameter
-Light mode template
This is version 1 of Hunttern ZigZag. We are very happy to receive feedback from you.


useful when used in conjunction with other indicators