• 概要
  • レビュー
  • コメント
  • 最新情報

Stops and Takes Auto Calculation

For more detailed description of the inputs please enter our comunnity ( https://discord.gg/UjxeJK9SsN )


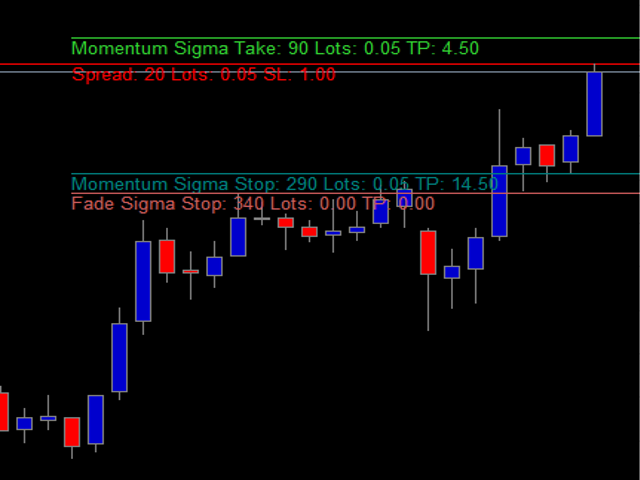
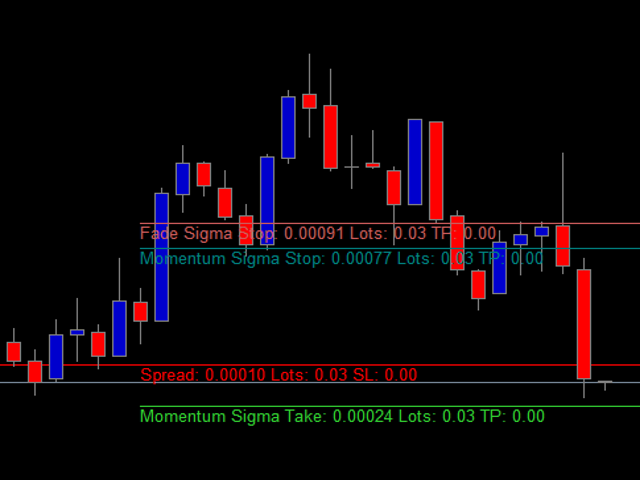
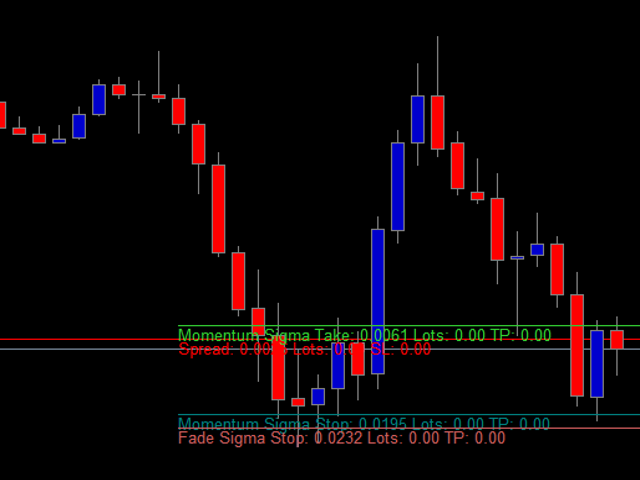
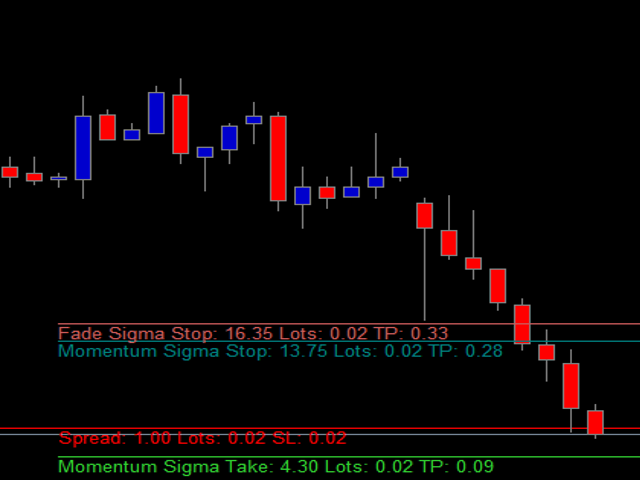
Automatic calculation of Stop Loss and Take Profit based on Volatility.

You can configure 5 stops and 5 takes difereent volatilities.

You can choose between a variable account (Lots gonna go up or down based on the account capital) or a fixed account based on the input.

In case you want a currency conversion between account and symbol, example USD account to EUR symbol, or another currency, please set true Currency conversions, but this action only works if you have the Expert Advisor Currency Conversion Update ( https://www.mql5.com/pt/market/product/79596 ).


If you want anything more than that just message me in the community ( https://discord.gg/P5mcttvXgw ) and I will update it for you!


おすすめのプロダクト
Functional in the Forex market. Functional in the B3 market - Bolsa Brasil Balcão. Motivation The technical Fibonacci retraction indicator for many is essential and the basis for all market movement forecasts. The name of the tool comes from the Italian mathematician Leonardo de Pisa (13th century). This DEMO version will work in Meta Trader with Demo and Strategy Tester. To purchase the Full version that works on a Real account, click on: https://www.mql5.com/en/market/product/38089
FREE
ピボットポイントフィボRSJは、フィボナッチレートを使用してその日のサポートラインとレジスタンスラインを追跡するインジケーターです。 この壮大な指標は、フィボナッチレートを使用してピボットポイントを通じて最大7レベルのサポートとレジスタンスを作成します。 価格がこのサポートとレジスタンスの各レベルを尊重する方法は素晴らしいです。そこでは、オペレーションの可能な入口/出口ポイントを認識することができます。 特徴 最大7レベルのサポートと7レベルの抵抗 レベルの色を個別に設定します 入力 ピボットタイプ ピボットフィボRSJ1 =フィボ比1の計算 ピボットフィボRSJ2 =フィボ比2の計算 ピボットフィボRSJ3 =フィボ比3の計算 ピボットフィボクラシック=クラシックピボット計算 最小ピボットレベル ピボット3レベル ピボット4レベル ピボット5レベル ピボット6レベル ピボット7レベル それでも質問がある場合は、ダイレクトメッセージで私に連絡してください: https://www.mql5.com/ja/users/robsjunqueira/
FREE
インディケータはチャート上にラウンドレベルを示します。 それらは、心理的、銀行的、または主要なプレーヤーレベルとも呼ばれます。 これらのレベルでは、強気と弱気の間に真の戦いがあり、多くの注文が蓄積され、ボラティリティの増加につながります。 インジケーターは、任意の楽器と時間枠に自動的に調整されます。 レベル80を突破してテストすると、購入します。レベル20を突破してテストすると、販売されます。ターゲットは00です。 注意。強力なサポートとレジスタンスレベルのため、価格は00レベルをわずかに下回る可能性があります。 入力パラメータ 。 Bars Count - 線の長さ 。 Show 00 Levels - 00レベルを表示するかしないか 。 Show 10, 90 Levels 。 Show 20, 80 Levels 。 Show 30, 70 Levels 。 Show 40, 60 Levels 。 Show 50 Levels 。 N Lines - チャートのレベル数を制限するパラメーター 。 Distance 00 Levels - レベル間の距離(自動または手動
FREE
Spike Catch Pro 22:03 release updates Advanced engine for searching trade entries in all Boom and Crash pairs (300,500 and 1000) Programmed strategies improvements Mx_Spikes (to combine Mxd,Mxc and Mxe), Tx_Spikes,   RegularSpikes,   Litho_System,   Dx_System,   Md_System,   MaCross,   Omx_Entry(OP),  Atx1_Spikes(OP),   Oxc_Retracement (AT),M_PullBack(AT) we have added an arrow on strategy identification, this will help also in the visual manual backtesting of the included strategies and see h
FREE
Free automatic Fibonacci is an indicator that automatically plots a Fibonacci retracement based on the number of bars you select on the BarsToScan setting in the indicator. The Fibonacci is automatically updated in real time as new highest and lowest values appears amongst the selected bars. You can select which level values to be displayed in the indicator settings. You can also select the color of the levels thus enabling the trader to be able to attach the indicator several times with differe
FREE
Marca Dagua
Erison Francisco De Sales
3 (1)
Adiciona marca d'água com nome do ativo em negociação. Pode ser ajustado definindo tamanho da fonte e coloração do texto. Testado com vários ativos do mercado B3 e Forex  Adione ao gráfico e configure de acordo com a necessidade. Caso tenha problemas sinta-se a-vontade para nos avisar e providenciaremos a correção logo que possível. ______________________________
FREE
Nameless Stochastic
Flavio Javier Jarabeck
5 (2)
It is the very same classic Stochastic indicator, but with a little twist: NO NAME and data is shown in the sub window. It could be stupid, BUT, if you are running out of space in Micro windows like Mini Charts, where the indicator's name is totally useless, you came to the right place. And that's it! I know it seems stupid but I needed the classical version of Stochastic indicator without that annoying name on my Mini Chart, so I did it that way... The original formula is right from Metaquote's
FREE
Volume Projection Indicator The Volume Projection Indicator is a specialized tool designed for traders who focus on the relationship between volume and price action. This intuitive indicator projects the expected volume for the ongoing candle, aiding in decision-making during live market conditions. The indicator presents volume data in a histogram format directly on the chart for quick analysis. Features: Bullish Volume Representation : Each green bar in the histogram signifies the volume for a
FREE
Cybertrade Keltner Channels - MT5 Created by Chester Keltner, this is a volatility indicator used by technical analysis. It is possible to follow the trend of financial asset prices and generate support and resistance patterns. In addition, envelopes are a way of tracking volatility in order to identify opportunities to buy and sell these assets. It works on periods longer than the period visible on the chart. All values ​​are available in the form of buffers to simplify possible automations.
FREE
Donchian Pro
Paulo Henrique Faquineli Garcia
5 (2)
The Donchian Channel Channels are among the most popular tools of technical analysis, as they visually convey to the analyst the limits within which most price movement tends to occur. Channel users know that valuable information can be obtained at any time, whether prices are in the central region of a band or close to one of the border lines. One of the best known techniques to explore these concepts is Bollinger Bands. However, John Bollinger was not the only one to research the applicatio
FREE
WaveTrend Plus
Nguyen Thanh Cong
5 (3)
Introduction WaveTrend Plus is an amazing oscillator that can detect optimal entry points in the market with high precision using complex computations of price and momentum. This version packs many improvements compared to the original WaveTrend such as cleaner visuals, oversold/overbought signals and divergence detection Signal Buy when oversold signal appear (green dot below) or when a bullish divergence is detected (green dashed line) Sell when overbought signal appear (red dot ab
FREE
Combining the best of Price Action , Directional Movement , and Divergence/Convergence analysis, Candle Color Trend is a easy and reliable way to identify trend direction. The indicator automatically paints the candles according to the assumption that an uptrend is defined by prices that form a series of higher highs and higher lows. In contrast, a downtrend is defined by prices that form a series of lower highs and lower lows. Additionally, ADX Wilder indicator is used to measure trend weakness
FREE
Are you tired of drawing trendlines every time you're analyzing charts? Or perhaps you would like more consistency in your technical analysis. Then this is for you. This indicator will draw trend lines automatically when dropped on a chart. How it works Works similar to standard deviation channel found on mt4 and mt5. It has 2 parameters: 1. Starting Bar 2. Number of bars for calculation The   starting bar   is the bar which drawing of the trend lines will begin, while the   number of bars for c
FREE
Standardize
Manuel Espinosa
5 (1)
The "Standardize" indicator   is a technical analysis tool designed to   standardize and smooth price or volume data to highlight significant patterns and reduce market noise, making it easier to interpret and analyze. Description & Functionality: Standardization : The indicator standardizes price or volume values by subtracting the mean and dividing by the standard deviation. This converts the data into a distribution with zero mean and standard deviation of one, allowing different data sets
FREE
PZ Fibonacci MT5
PZ TRADING SLU
4.57 (14)
Are you tired of plotting Fibonacci retracements or extensions manually? This indicator displays Fibo retracements or extensions automatically, calculated from two different price points, without human intervention or manual object anchoring. [ Installation Guide | Update Guide | Troubleshooting | FAQ | All Products ] Easy to use Manual anchoring is not needed Perfect for price confluence studies The indicator evaluates if retracements or extensions are needed Once drawn, you can manually edit t
FREE
Necessary for traders: tools and indicators Waves automatically calculate indicators, channel trend trading Perfect trend-wave automatic calculation channel calculation , MT4 Perfect trend-wave automatic calculation channel calculation , MT5 Local Trading copying Easy And Fast Copy , MT4 Easy And Fast Copy , MT5 Local Trading copying For DEMO Easy And Fast Copy , MT4 DEMO Easy And Fast Copy , MT5 DEMO The homeopathic indicator is also called the CCI indicator. The CCI indicator was propos
FREE
Calculate the Variance of prices on the chosen time frame and compare with the price range reached. Or in other words how mutch is price moving in the recent candles? Two impots: Candle = 4 (Default) number of previous candle to calculate Backward = 500 (Default) How many candle to go backward Variance is calculated as follow: Variance(X) = Average(X 2 ) – [Average(X)] 2 Subsequently Variance is rapported to the price range fo the chosen period (i.e. 4 candles) Indicator =    Variance(X) / (
FREE
Best SAR MT5
Ashkan Hazegh Nikrou
5 (1)
説明 :  外国為替市場(PSAR)で専門的で人気のあるインジケーターの1つに基づいた新しい無料インジケーターをご紹介します。このインジケーターは元のパラボリックSARインジケーターの新しい変更です。プロSARインジケーターでは、ドットと価格チャートのクロスオーバーを見ることができます。クロスオーバーはシグナルではありませんが、動きの終わりの可能性について話します。新しい青いドットで購入を開始し、最初の青いドットの1 atr前にストップロスを配置し、最後にドットが価格チャートを横切るとすぐに終了できます。 売買シグナルを開く方法は? 最初の青い点によるオープンバイトレードと最初の赤いドットによるオープンセルトレード 正しいストップロスはどこにありますか? 安全なストップロスは最初のドットにある可能性があります(最初の青いドットの買いの場合と最初の赤い点の売りの場合) 正しいテイクプロフィットはどこにありますか? テイクプロフィットはストップロス距離とRRに基づいて調整できるので、私の提案は2 RRで、ストップロスの2倍です。 利益を上げているのにtpを達成でき
FREE
Value Chart Candlesticks
Flavio Javier Jarabeck
4.75 (8)
The idea of a Value Chart indicator was presented in the very good book I read back in 2020 , " Dynamic Trading Indicators: Winning with Value Charts and Price Action Profile ", from the authors Mark Helweg and David Stendahl. The idea is simple and the result is pure genius: Present candlestick Price analysis in a detrended way! HOW TO READ THIS INDICATOR Look for Overbought and Oversold levels. Of course, you will need to test the settings a lot to find the "correct" one for your approach.
FREE
Stackable VWAP
Flavio Javier Jarabeck
3 (3)
Volume Weighted Average Price (VWAP) is a trading benchmark commonly used by Big Players that gives the average price a Symbol has traded throughout the day. It is based on both Volume and price. Additionally we put in this indicator the MVWAP (Moving Volume Weighted Average Price). For those who do not know the usage and the importance od this indicator I recommend a great article about this subject at Investopedia ( https://www.investopedia.com/articles/trading/11/trading-with-vwap-mvwap.asp
FREE
A ideia do indicador é mudar de cores assim que o candle viole a banda; Caso o candle viole a banda superior, pinta o candle de vermelho, Caso o candle viole a banda inferior , pinta o candle de verde, Se o candle passar em algum momento pela média, ele assume uma cor acinzentada; Os candles que não passem pela média, nem violem a banda, apresentarão cor verde fraca, se for de alta e cor vermelha fraca se for de baixa. Projeto concebido no canal Aprenda a programar, keltner cores.
FREE
This is a buyer and seller aggression indicator that analyzes the shape of each candle and project this data in a histogram form. There are 4 histograms in one. On the front we have two: Upper - Buyer force. Lower - Seller force. At the background we also have two histogram, both with same color. They measure the combined strenght of buyers and sellers. This histograms can be turned off in Input Parameters. It is also possible to have the real or tick volume to help on this force measurement. IN
FREE
Midas VWAP
Paulo Henrique Faquineli Garcia
4 (1)
Volume Weighted Average Price (VWAP) is a trading benchmark commonly used by Big Players that gives the average price a Symbol has traded throughout the day. It is based on both Volume and price. This indicator contains Daily VWAP and MIDAS' VWAP, which means you are able to anchor the beggining of MIDAS' calculations and, therefore you will be able to use this methodology to study price versus volume moves after anchor point. You will be able to anchor up to 3 HIGH MIDAS VWAP's and 3 LOW. Wis
FREE
En esta versión, las alertas están funcionando y en la versión que publicó, la zona muerta de atr era solo una zona muerta sin atr, por lo que también la convirtió en una zona muerta de atr. Indicator input parameters   input int Fast_MA = 20;       // Period of the fast MACD moving average input int Slow_MA = 40;       // Period of the slow MACD moving average input int BBPeriod=20;        // Bollinger period input double BBDeviation=2.0; // Number of Bollinger deviations input int  Sensetiv
FREE
Bounce Zone MT5
Nguyen Thanh Cong
4.33 (3)
Introduction The Bounce Zone indicator is a cutting-edge non-repainting technical tool built to identify key areas on the price chart where market sentiment is likely to cause a significant price reversal. Using advanced algorithms and historical price data analysis, this indicator pinpoints potential bounce zones. Combined with other entry signal, this indicator can help forex traders place the best trades possible Signal A possible buy signal is generated when price is in the green zo
FREE
トレンドキャッチャー: アラートインジケーター付きのトレンドキャッチャーストラテジーは、市場トレンドやポテンシャルなエントリーポイントやエグジットポイントを特定するのに役立つ多目的な技術分析ツールです。動的なトレンドキャッチャーストラテジーを備えており、市場状況に適応してトレンドの方向を明確に視覚化します。トレーダーは、自身の好みやリスク許容度に合わせてパラメーターをカスタマイズできます。このインジケーターはトレンドの識別を支援し、ポテンシャルなリバーサルをシグナルし、トレイリングストップのメカニズムとして機能し、市場への迅速な対応のためのリアルタイムアラートを提供します。 特徴: - トレンドの識別:上昇トレンドと下降トレンドをシグナルします。 - トレンドのリバーサル:ローソク足の色が上昇から下降に変わった場合やその逆の場合に、ポテンシャルなリバーサルを警告します。 - リアルタイムアラート:新しいトレンドの識別に対するアラートを生成します。 推奨事項: - 通貨ペア:EURUSD、AUDUSD、XAUUSDなど... - タイムフレーム:H1。 - アカウン
FREE
High Low Open Close
Alexandre Borela
4.97 (35)
このプロジェクトが好きなら、5つ星レビューを残してください。 インスタグラムでフォロー:borelatech このインジケータは、指定されたためのオープン、ハイ、ロー、クローズ価格を描画します 特定のタイムゾーンの期間と調整が可能です。 これらは、多くの機関や専門家によって見られた重要なレベルです トレーダーは、彼らがより多くのかもしれない場所を知るために有用であり、 アクティブ。 利用可能な期間は次のとおりです。 前の日。 前週。 前の月。 前の四半期。 前年。 または: 現在の日。 現在の週。 現在の月。 現在の四半期。 現年。
FREE
Follow The Line MT5
Oliver Gideon Amofa Appiah
4.48 (27)
This indicator obeys the popular maxim that: "THE TREND IS YOUR FRIEND" It paints a GREEN line for BUY and also paints a RED line for SELL. (you can change the colors). It gives alarms and alerts of all kinds. IT DOES NOT REPAINT and can be used for all currency pairs and timeframes. Yes, as easy and simple as that. Even a newbie can use it to make great and reliable trades. NB: For best results, get my other premium indicators for more powerful and reliable signals. Get them here: https://www.m
FREE
Expansoes M
Marcus Vinicius Da Silva Miranda
The M Extensions are variations of the Golden Ratio (Fibonacci Sequence). It is the World's first technique developed for Candle Projections. Advantages: Easy to plot. Candle anchoring; High and accurate precision as support and resistance; Excellent Risk x Return ratio; Works in any timeframe; Works in any asset / market.   The M Extensions are classified into: M0: Zero point (starting candle) RC: Initial candle control region M1: Extension region 1 M2: Extension region 2 M3: Extension r
FREE
このプロダクトを購入した人は以下も購入しています
まず第一に、この取引インジケーターは再描画されず、再描画されず、遅延しないことを強調する価値があります。これにより、手動取引とロボット取引の両方に理想的なものになります。 ユーザーマニュアル:設定、入力、戦略。 アトミックアナリストは、価格の強さとモメンタムを利用して市場でより良いエッジを見つけるためのPA価格アクションインジケーターです。ノイズや誤ったシグナルを除去し、取引ポテンシャルを高めるための高度なフィルターを備えています。複雑なインジケーターの複数のレイヤーを使用して、アトミックアナリストはチャートをスキャンし、複雑な数学的計算をシンプルなシグナルと色に変換します。これにより、どのような初心者トレーダーでも理解して使用し、一貫した取引の決定を行うことができます。 「アトミックアナリスト」は、新規および経験豊富なトレーダー向けにカスタマイズされた包括的な取引ソリューションです。プレミアムインジケーターとトップノッチの機能を1つの取引戦略に組み合わせ、すべてのタイプのトレーダーにとって汎用性のある選択肢にします。 デイリートレーディングとスキャルピング戦略:高速で正確な
AtBot: どのように機能し、どのように使用するか ### どのように機能するか MT5プラットフォーム用の「AtBot」インジケーターは、テクニカル分析ツールの組み合わせを使用して売買シグナルを生成します。単純移動平均(SMA)、指数移動平均(EMA)、および平均真実範囲(ATR)インデックスを統合して取引機会を特定します。さらに、Heikin Ashiキャンドルを使用してシグナルの精度を向上させることもできます。 購入後にレビューを残すと、特別なボーナスギフトを受け取ります。 ### 主な機能: - 再描画なし: シグナルはプロット後に変更されません。 - 再描画なし: シグナルは一貫しており、変更されません。 - 遅延なし: 遅延なくタイムリーなシグナルを提供します。 - 多様な時間枠: あらゆる時間枠で使用可能で、取引戦略に合わせることができます。 ### 操作手順: #### 入力と設定: - firstkey (TrendValue): トレンド検出の感度を調整します。 - Secondkey (SignalValue): 売買シグナル生成の感度を定義します。 - ma
まず第一に、このトレーディングシステムがノンリペイント、ノンリドロー、ノンラグのインジケーターであることを強調する価値がある。これにより、手動取引とロボット取引の両方に理想的なものになっています。 オンラインコース、マニュアル、プリセットのダウンロード。 「スマートトレンドトレーディングシステム MT5」は、新規および経験豊富なトレーダー向けにカスタマイズされた包括的なトレーディングソリューションです。10以上のプレミアムインジケーターを組み合わせ、7つ以上の堅実なトレーディング戦略を備えており、多様な市場状況に対応する多目的な選択肢となっています。 トレンドフォロー戦略:トレンドを効果的に乗り越えるための正確なエントリーとストップロス管理を提供します。 リバーサル戦略:潜在的なトレンドの反転を特定し、トレーダーがレンジ相場を活用できるようにします。 スキャルピング戦略:高速で正確なデイトレードおよび短期取引のために設計されています。 安定性:すべてのインジケーターはノンリペイント、ノンリドロー、ノンラグであり、信頼性の高いシグナルを保証します。 カスタマイズ:個々の取引の嗜好に合わせ
最初のパルスレベルを反転 (RFI)     指示する     ロシア     -        utilizar con   el indicador の ESP 推奨事項 -   TPSpro トレンド プロフェッショナル版 -   MT5のバージョン 最も重要なことは、将来においても最も重要なことです。 機能のプリンシパル: ゾーンのほとんどは、ベンダーとコンプラドールによってアクティブ化されます。 状況を直感的に把握できるよう、初期の衝動を修正します。 LOGIC AI: MUESTRA zonas (círculos) parabuscar puntos de entrada cuando se activa una plantilla 視覚的に優れた視覚効果があり、最も重要な機能がすべて揃っていることに注意してください。 優れたニベレス/ゾーンの視覚化 (modo MTF) 世界で最も人気のある場所/ゾーンです。これを使用するのに最適な方法です (   TPSproTREND PRO   )。 アルゴリズム プロフェッショナル セパラド パソ ア パソ パラ オペラ それは
Quantum Trend Sniper
Bogdan Ion Puscasu
4.82 (45)
ご紹介   クォンタム トレンド スナイパー インジケーターは 、トレンド反転を特定して取引する方法を変革する画期的な MQL5 インジケーターです。 13年以上の取引経験を持つ経験豊富なトレーダーのチームによって開発されました。     クォンタムトレンドスナイパーインジケーター   は、非常に高い精度でトレンドの反転を識別する革新的な方法で、あなたのトレーディングの旅を新たな高みに押し上げるように設計されています。 ***Quantum Trend Sniper Indicatorを購入すると、Quantum Breakout Indicatorを無料で入手できます!*** クォンタム ブレイクアウト インジケーターは、トレンドの反転を特定するとアラートを発し、矢印を示し、3 つのテイクプロフィットレベルを提案します。 初心者トレーダーにもプロのトレーダーにも適しています。 量子EAチャネル:       ここをクリック MT4のバージョン:       ここをクリック 推奨事項: 期間:すべての時間枠。最良の結果を得るには、M
TPSpro TREND PRO は 、市場を自動的に分析し、トレンドとその各変化に関する情報を提供し、再描画せずに取引にエントリーするためのシグナルを提供するトレンド指標です。 インジケーターは各ローソク足を使用し、個別に分析します。上向きまたは下向きのさまざまな衝撃を指します。通貨、仮想通貨、金属、株、指数の取引への正確なエントリーポイント! バージョンMT5                   インジケーターの完全な説明     RFI LEVELS インジケーター と併用することをお勧めします。 主な機能: レンダリングなしで正確な入力信号! シグナルが表示されると、それは関連性を維持します。これは、シグナルを提供してからそれを変更し、その結果、入金された資金が失われる可能性があるリドローインジケーターとの重要な違いです。より高い確率と精度で市場に参入できるようになりました。矢印が表示された後、ターゲットに到達する (利益確定) か反転シグナルが表示されるまで、ローソク足に色を付ける機能もあります。 STOP-LOSS/TAKE-PROFITゾーンの表示 エントリーポイン
Gold Stuff mt5
Vasiliy Strukov
4.9 (125)
Gold Stuff mt5 は、金専用に設計されたトレンド指標であり、あらゆる金融商品にも使用できます。 インジケーターは再描画せず、遅れません。 推奨時間枠 H1. 設定と個人的なボーナスを得るために、購入後すぐに私に連絡してください!  トレンド スキャナーの強力なサポートを利用して、無料のインジケーターを入手し、プライバシーを守ります。あーみー!   設定 矢印を描く - オンオフ。 チャートに矢印を描く。 アラート - 可聴アラートのオンオフ。 メール通知 - オンオフ。 電子メール通知。 プチ通知 - オンオフ。 プッシュ通知。 次に、色域を調整します。 Gold Stuff mt5 は、金専用に設計されたトレンド指標であり、あらゆる金融商品にも使用できます。 インジケーターは再描画せず、遅れません。 推奨時間枠 H1. 設定と個人的なボーナスを得るために、購入後すぐに私に連絡してください!   設定 矢印を描く - オンオフ。 チャートに矢印を描く。 アラート - 可聴アラートのオンオフ。 メール通知 - オンオフ。 電子メール通知。 プチ通
mql5と Telegramの モーニング・ブリーフィングで、詳細とスクリーンショットを含む毎日のマーケット・アップデートをご覧 ください! FX Power MT5 NGは 、長年の人気を誇る通貨強度計FX Powerの次世代モデルです。 この次世代ストレングスメーターは何を提供するのでしょうか?初代FXパワーの魅力すべて プラス GOLD/XAUの強さ分析 より正確な計算結果 個別に設定可能な分析期間 カスタマイズ可能な計算上限値により、さらに優れたパフォーマンスを実現 もっと見たい人のための特別なマルチインスタンス設定 すべてのチャートでお好みの色を無限に設定可能 数え切れないほどの通知オプションにより、重要なことを見逃すことはありません。 Windows 11とmacOSのスタイルで角を丸くした新しいデザイン 魔法のように動くインジケーターパネル FXパワーの主な機能 すべての主要通貨の強さの完全な履歴 すべての時間枠における通貨の強さの履歴 すべてのブローカーとチャートで同一の計算結果 100%信頼できるリアルタイム計算 -> リペイントなし ドロップダウン・リストから
トレンド スクリーナー インジケーターでトレンド取引の力を解き放ちます。ファジー ロジックと複数通貨システムを活用した究極のトレンド取引ソリューションです。 ファジー ロジックを活用した革新的なトレンド インジケーターである Trend Screener を使用して、トレンド取引を向上させます。 これは、13 を超えるプレミアム ツールと機能、および 3 つの取引戦略を組み合わせた強力なトレンド追跡インジケーターであり、Metatrader をトレンド アナライザーにする多用途の選択肢となります。 期間限定オファー : トレンド スクリーナー インジケーターは、わずか 50 ドルで生涯ご利用いただけます。 (元の価格 125$ ) (オファー延長) Trend Screener の 100% 非再描画精度の揺るぎない精度を体験して、取引の決定が過去の価格変動の影響を受けないようにしてください。 マルチタイムフレームおよびマルチ通貨機能の多用途性を解放し、比類のない自信を持って外国為替、商品、暗号通貨、インデックスの世界を取引できるようにします。 Trend Screener の包括的な
今、147ドル(いくつかの更新後に499ドルに増加します) - 無制限のアカウント(PCSまたはMac) RelicusRoad ユーザー マニュアル + トレーニング ビデオ + プライベート Discord グループへのアクセス + VIP ステータス 市場の新しい見方 RelicusRoad は、外国為替、先物、暗号通貨、株式、および指数の世界で最も強力な取引インジケーターであり、トレーダーに収益を維持するために必要なすべての情報とツールを提供します。初心者から上級者まで、すべてのトレーダーが成功するためのテクニカル分析と取引計画を提供します。これは、将来の市場を予測するのに十分な情報を提供する重要な取引指標です。意味をなさないチャート上のいくつかの異なる指標ではなく、完全な解決策を信じています.これは、信号、矢印 + 価格アクション情報を表示するオールインワンのインジケーターで、他に類を見ない非常に正確です。 強力な AI に基づいて、RelicusRoad は不足している情報とツールを提供して、あなたを教育し、トレーディングのプロ、成功したトレーダーにします。
まず第一に、この取引ツールはノンリペイント、ノンリドロー、ノンラグの指標であり、プロの取引に理想的ですことを強調する価値があります。 オンラインコース、ユーザーマニュアル、デモ。 スマートプライスアクションコンセプトインジケーターは、新米から経験豊富なトレーダーまで、非常 に強力なツールです。Inner Circle Trader AnalysisやSmart Money Concepts Trading Strategiesなど、20以上の有用な指標を1つに組み合わせています。このインジケーターはスマートマネーコンセプトに焦点を当て、大手機関の取引方法を提供し、彼らの動きを予測するのに役立ちます。 特に、流動性分析に優れており、機関がどのように取引しているかを理解しやすくしています。市場のトレンドを予測し、価格の動きを慎重に分析するのに優れています。機関の戦略とトレードを合わせることで、市場の動向についてより正確な予測ができます。このインジケーターは多目的であり、市場構造を分析し、重要な注文ブロックを特定し、さまざまなパターンを認識するのに優れています。 このインジ
これはMT5のインジケーターで、再描画なしで取引に参入するための正確なシグナルを提供します。 外国為替、暗号通貨、金属、株式、インデックスなど、あらゆる金融資産に適用できます。かなり正確な見積もりを提供し、取引を開始して終了するのに最適な時期を教えてくれます。1つのシグナルを処理しただけでインジケーターの元が取れた例の 動画 (6:22)をご覧ください。Entry PointsPro インジケーターの助けを借りたほとんどのトレーダーの最初の1週間の結果が改善しています。 Telegramグループ に登録してください。Entry Points Proインジケーターのメリットは次の通りです。 再描画のないエントリーシグナル 再描画されるインジケーターでは一度表示されたシグナルが削除されて大きな金銭的損失につながることがありますが、これと異なり、表示されて確認されたシグナルは消えることがありません。 エラーなしの取引開始 インジケーターアルゴリズムによって取引を開始する(資産を売買する)理想的な瞬間を見つけることができます。それを使用するすべてのトレーダーの成功率が向上します。
mql5と Telegramの モーニング・ブリーフィングで、詳細とスクリーンショットを含む毎日のマーケット・アップデートをご覧 ください! FX Volumeは、ブローカーの視点から市場のセンチメントをリアルに洞察する、最初で唯一の出来高インジケーターです。 ブローカーのような機関投資家が外国為替市場でどのようなポジションをとっているか、COTレポートよりもはるかに速く、素晴らしい洞察を提供します。 この情報をチャート上で直接見ることは、あなたの取引にとって真のゲームチェンジャーであり、画期的なソリューションです。 以下のようなユニークなマーケットデータ洞察から利益を得てください。 比率は 、通貨のロングポジションとショートポジションの比率をパーセントで表示します。 比率の変化は 、選択した期間内のロング比率とその変化率を表示します。 Volumes Totalは 、通貨の取引量(ロングとショート)の合計をロット単位で表示します。 Volumes Long :全通貨のロングポジションの取引量を表示します。 Volumes(ショート )は、全通貨のショートポジションの取引量を表示
Trend Hunter は、外国為替、仮想通貨、CFD 市場におけるトレンド指標です。 このインジケーターの特別な特徴は、価格がトレンドラインをわずかに突き抜けたときにシグナルを変更することなく、自信を持ってトレンドに従うことです。 インジケーターは再描画されず、バーが閉じた後に市場に参入するシグナルが表示されます。 トレンドに沿って移動すると、インジケーターにはトレンドの方向に追加のエントリーポイントが表示されます。 これらのシグナルに基づいて、小さなストップロスで取引できます。 トレンドハンターは正直な指標です。 インジケーター信号の上にマウスを置くと、信号の潜在的な利益と可能なストップが表示されます。 新しい信号が表示されると、次の通知を受け取ることができます。 アラート プッシュ通知 メールによる通知 電報での通知 チャートのスクリーンショットも Telegram に送信されるため、取引を決定するために端末を開く必要はありません。 インジケーターシグナルは、電報チャネル https://www.mql5.com/ja/market/product/11085
IX Powerは 、FX Powerの無敵の精度をついにFX以外のシンボルにも提供します。 お気に入りの指数、株式、コモディティ、ETF、さらには暗号通貨の短期、中期、長期のトレンドの強さを正確に判断します。 お使いの端末が提供する すべてを分析する ことができます。ぜひお試しいただき、取引 タイミングが大幅に改善 されることをご体験ください。 IXパワーの主な特徴 100%正確で再描画されない計算結果 - ターミナルで利用可能なすべての取引シンボルに対して 予め設定され、さらに個別に設定可能な強度分析期間のドロップダウン選択 Eメール、メッセージ、モバイル通知による無数の通知オプション EAリクエストのためのアクセス可能なバッファ カスタマイズ可能な計算制限により、さらに優れたパフォーマンスを実現 もっと見たい人のための特別なマルチインスタンス設定 すべてのチャートでお好みの色を無限に設定可能 Windows 11とmacOSのスタイルで角を丸くした新しいパネルデザイン サブ・ウィンドウとメイン・チャートの間をシームレスに移動する、魔法のように動くイン
発見が困難で頻度が少ないため、分岐は最も信頼できる取引シナリオの1つです。このインジケーターは、お気に入りのオシレーターを使用して、通常の隠れた分岐点を自動的に見つけてスキャンします。 [ インストールガイド | 更新ガイド | トラブルシューティング | よくある質問 | すべての製品 ] 取引が簡単 通常の隠れた発散を見つけます 多くのよく知られている発振器をサポート ブレイクアウトに基づいて取引シグナルを実装します 適切なストップロスおよび利益レベルを表示します 設定可能なオシレーターパラメーター カスタマイズ可能な色とサイズ バー単位でサイズ別に分岐をフィルタリング パフォーマンス統計を実装します 電子メール/音声/視覚アラートを実装します 幅広い市場の見通しを提供するために、異なるオシレーターを使用して、干渉なしで同じチャートにインジケーターを何度もロードできます。このインジケーターは、次のオシレーターをサポートしています。 RSI CCI MACD オスマ 確率的 勢い 素晴らしい発振器 加速器発振器 ウィリアムズパーセントレンジ 相対活力指数 特に外国為替市
Golden Spikes Detector Acknowledgement and Dedications:  The name of this indicator was Inspired by an Original; Mr Grant Koopman; a Knowledgeable and experienced Synthetics trader. I dedicate this indicator to Mr Grant.  Overview: The Golden Spikes Premium is a groundbreaking trading indicator meticulously crafted for the Boom and Crash indices on the Deriv market. Tailored to meet the needs of discerning traders, this powerful tool operates exclusively on the one-minute timeframe, providin
Easy By Sell is a market indicator for opening and closing positions. It becomes easy to track market entries with alerts. It indicates trend reversal points when a price reaches extreme values ​​and the most favorable time to enter the market. it is as effective as a Fibonacci to find a level but it uses different tools such as an algorithm based on ATR indicators and Stochastic Oscillator. You can modify these two parameters as you wish to adapt the settings to the desired period. My othe
ブレーカートレーダーになり、価格が反転すると市場構造からの利益が変化します。 注文ブロックブレーカーインジケーターは、トレンドまたは価格の動きが枯渇に近づいており、逆転の準備ができていることを識別します。通常、反転または大規模なプルバックが発生しようとしているときに発生する市場構造の変化について警告します。 この指標は、ブレイクアウトと価格の勢いを識別する独自の計算を使用します。使い果たされる可能性のあるポイントの近くで新しい高値が形成されるたびに、インディケーターはその高値の作成を担当する最後の注文ブロックを描きます。次に、移動する価格とともに注文ブロックを追跡します。その後、価格が反対方向にシフトし、その注文ブロックを突破すると、新しい市場構造を作成し、トレンドまたは大きな後退の可能性のある反転の開始を警告します。 注文ブロックは、高値/安値が作成される前の最後の反対色のろうそくであり、価格がこれらの重要な領域を下抜けすると、トレンドの短期的ま​​たは長期的な反転の兆候です。 特徴 重要な枯渇点での市場構造の変化を警告します 価格が使い果たされるレベルに近づくと、
ATrend: その仕組みと使い方 仕組み MT5プラットフォーム向けの「ATREND」インジケーターは、テクニカル分析手法の組み合わせを利用して、トレーダーに堅牢な買いと売りのシグナルを提供するように設計されています。このインジケーターは主に、ボラティリティ測定のために平均真の範囲(ATR)を活用し、潜在的な市場動向を特定するためのトレンド検出アルゴリズムを併用しています。 購入後にメッセージを残すと、特別なボーナスギフトが贈呈されます。 39ドルの価格で残り8部 主な特徴: - ダイナミックなトレンド検出: インジケーターは市場トレンドを評価し、シグナルを適宜調整することで、トレーダーが優位な市場環境に合わせて戦略を立てるのを支援します。     - ボラティリティ測定: ATRを使用することで、インジケーターは最適なストップロス(SL)とテイクプロフィット(TP)レベルを決定するために不可欠な市場ボラティリティを測定します。 - シグナルの視覚化: インジケーターは、チャート上に買いと売りのシグナルを視覚的に表示することで、トレーダーの意思決定を強化します。 操作手順 入力
Gartley Hunter Multi - An indicator for searching for harmonic patterns simultaneously on dozens of trading instruments and on all possible timeframes. Manual (Be sure to read before purchasing) | Version for MT4 Advantages 1. Patterns: Gartley, Butterfly, Shark, Crab. Bat, Alternate Bat, Deep Crab, Cypher 2. Simultaneous search for patterns on dozens of trading instruments and on all possible timeframes 3. Search for patterns of all possible sizes. From the smallest to the largest 4. A
Auto Order Block with break of structure based on ICT and Smart Money Concepts (SMC) Futures Break of Structure ( BoS )             Order block ( OB )            Higher time frame Order block / Point of Interest ( POI )    shown on current chart           Fair value Gap ( FVG ) / Imbalance   -  MTF      ( Multi Time Frame )    HH/LL/HL/LH  -  MTF      ( Multi Time Frame )  Choch  MTF      ( Multi Time Frame )  Volume Imbalance     ,  MTF          vIMB Gap’s Power of 3 Equal High
収益性の高い取引機会を簡単に特定するのに役立つ強力な外国為替取引インジケーターをお探しですか?ビースト スーパー シグナル以外に探す必要はありません。 この使いやすいトレンドベースのインジケーターは、市場の状況を継続的に監視し、新しいトレンドを検索したり、既存のトレンドに飛びついたりします。ビースト スーパー シグナルは、すべての内部戦略が一致し、互いに 100% 合流したときに売買シグナルを発するため、追加の確認は不要です。シグナル矢印アラートを受け取ったら、単に売買します。 購入後、プライベート VIP グループに追加されるようにメッセージを送ってください! (完全な製品購入のみ)。 購入後、最新の最適化されたセット ファイルについてメッセージを送ってください。 MT4版は こちらから。 Beast Super Signal EA は こちらから 入手できます。 コメント セクションをチェックして、最新の結果を確認してください。 ビースト スーパー シグナルは、1:1、1:2、または 1:3 のリスクと報酬の比率に基づいて、エントリー価格、ストップ
ICT, SMC, SMART MONEY CONCEPTS, SMART MONEY, Smart Money Concept, Support and Resistance, Trend Analysis, Price Action, Market Structure, Order Blocks, BOS/CHoCH,   Breaker Blocks ,  Momentum Shift,   Supply&Demand Zone/Order Blocks , Strong Imbalance,   HH/LL/HL/LH,    Fair Value Gap, FVG,  Premium  &   Discount   Zones, Fibonacci Retracement, OTE, Buy Side Liquidity, Sell Side Liquidity, BSL/SSL Taken, Equal Highs & Lows, MTF Dashboard, Multiple Time Frame, BigBar, HTF OB, HTF Market Structure
The Smart Liquidity Profile is color-coded based on the importance of the traded activity at specific price levels, allowing traders to identify significant price levels such as support and resistance levels, supply and demand zones, liquidity gaps, consolidation zones, Buy-Side/Sell-Side Liquidity and so on.  Smart Liquidity Profile allows users to choose from a number of different time periods including 'Auto,' 'Fixed Range,' 'Swing High,' 'Swing Low,' 'Session,' 'Day,' 'Week,' 'Month,' 'Quart
** All Symbols x All Timeframes scan just by pressing scanner button ** ***Contact me after purchase to send you instructions and add you in "123 scanner group" for sharing or seeing experiences with other users. After 17 years of experience in the markets and programming, Winner indicator is ready. I would like to share with you! Introduction The 123 Pattern Scanner indicator with a special enhanced algorithm is a very repetitive common pattern finder with a high success rate . Interestingly,
Sweet VWAP Anchored MT5
Francisco Gomes Da Silva
5 (2)
時間を節約し、より正確な意思決定を Sweet VWAP で このツールのパワーをテストしたい場合、 MetaTrader 5 用の無料のアンカード VWAP インディケーター をダウンロードできます。 このインディケーターは独立して動作するだけでなく、無料版 Sweet VWAP の拡張機能でもあります。 無料版をクリックすると、マウスポインターで見える VWAP が固定されます。そして、固定されるのはこのインディケーターであり、その機能をすべて備えています。 このインディケーターは Sweet VWAP と完全に統合されています。これは MetaTrader 5 用の無料のアンカード VWAP インディケーターです。 機能 アンカーする時間 これは VWAP をアンカーしたいローソク足です。これは Sweet VWAP(無料版)が自動的に行います。チャートでクリックするだけです。 取引量の種類 取引量の種類を選択するか、自動にしておくことができます。自動の場合、ブローカーがこの情報を提供している場合、取引アセットの実際の取引量を優先して使用します。 VWAP の平滑化メソッド 単純
このダッシュボードは、選択されたシンボルの最新の利用可能なハーモニックパターンを表示するので、時間を節約し、より効率的に /   MT4バージョン 。 無料インジケーター:   Basic Harmonic Pattern インジケーター列 Symbol : 選択したシンボルが表示されます。 Trend :   強気または弱気 Pattern : パターンの種類(ガートレー、バタフライ、バット、カニ、サメ、サイファー、ABCD) Entry : エントリー価格 SL: ストップロス価格 TP1: 1回目の利食い価格 TP2: 2回目の利食い価格 TP3:   3回目の利食い価格 Current price :   現在値 Age (in bars):    最後に描画されたパターンの年齢 主な入力項目 Symbols:   "28 Major Currency Pairs "または "Selected Symbols "から選択。 Selected Symbols:   カンマで区切られた監視したいシンボル("EURUSD,GBPUSD,XAUUSD")。ブローカーが
サポート線と抵抗線のプロットにうんざりしていませんか? サポートレジスタンス は、非常に興味深いひねりを加えてチャート内のサポートとレジスタンスラインを自動検出およびプロットするマルチタイムフレームインジケーターです。価格レベルは時間とともにテストされ、その重要性が高まるにつれて、ラインは太くなり、暗くなります。 [ インストールガイド | 更新ガイド | トラブルシューティング | よくある質問 | すべての製品 ] 一晩でテクニカル分析を強化 チャートを閲覧せずに重要な価格レベルを検出 一目ですべての価格レベルの相対的な強さを認識する すべての取引で最大30時間のプロットラインを節約 インジケーターは、すべての価格レベルの年齢を表示します インジケーターは再描画されていません 過去および現在の価格レベルは近接によって崩壊し、現在の市場行動に合わせて調整されます。動作は、必ずしもピークではない場所に線が引かれます。 価格レベルは、時間とともに拒否されるにつれて、より暗く、より広くなります ノイズを避けるために、重要でない価格レベルは定期的にクリアされます カスタマイズ可能な時間枠の
FX Trend MT5
Daniel Stein
4.56 (27)
常に利益を出し続ける5つ星FXトレーダーになりたいですか? 購入時のスクリーンショットを送信して、専用トレーディングチャットへの個人的な招待を受ける FXトレンド は、すべての時間枠のトレンド方向、期間、強度、その結果のトレンド評価をリアルタイムで表示します。 トレンドがどの方向に動いているか、どのくらい続いているか、どのくらい強力かが一目瞭然です。 これらにより初心者、上級者およびプロのトレーダーにとって使いやすいトレンド取引システムとなって います 。 分析機能 全時間軸のリアルタイムトレンド分析 すべてのタイムフレームで同一の計算結果 時間枠を個別に設定することが可能 トレンドの計算パラメータをカスタマイズ可能 グラフィック機能 コンパクトモード、詳細モード、ダッシュボードモードをワンクリックで切り替え可能 コンパクトモードでは、基本的なトレンド情報を縮小パネルで表示します。 詳細モードでは、基礎となるシンボルの詳細なトレンド分析が可能です。 ダッシュボードモードは、すべてのメジャー銘柄やお気に入りの取引銘柄をカバーします。 パネル内でワンクリックするだけで、すべて
作者のその他のプロダクト
Lot Size Calculation, based on mouse click on the start and click on the end of the measure! For proper measurement click with the middle mouse button then choose the first value then right click and drag until the last price you want then release the right button It shows the Stop Loss with minimum lots, your ideal lots, and the Stop Loss in price. Everything is based on a Percentage or Cash Risk per Trade, if is Percentage, you can choose between compound and a fix account value. To use curr
FREE
For more support and resistance check Support and Resistance for All Market Cycles For more details of the inputs please enter our comunnity (  https://discord.gg/GHFZkKkEBq ) High and Low of the Day Highest and Lowest Close of the Day High and Low of Previous x Bars divided by x times (Variable based on inputs) Bars Maximum represents the max of previous bars you want Progression is how much lines you want, and consecutively how often is it divided bars maximum You can pick and choose what
FREE
Measures the average price and Maximum Stop Loss accepted, adjustable Measures too the projected average price (For Pending entrys), in case you have a open position and pending orders to scale in shows how much it will increase or decrease the average price after fullfilling that pending orders! It shows too the Stop Loss based on the projected average entry, how much it has to be stoped out to fullfill your risk management, after fullfilling that pending orders
FREE
Apenas Fecha Posições Parcialmente Exceução de fechar parte da posição de modo rápido, funciona em Conta Hedge e Netting Para mais detalhes de configurações e input de variáveis entre em nossa comunidade no guilded ( https://www.guilded.gg/i/E9m8bYLE ) Inclui Rompimentos, Canais Estreitos, Canais Amplos e Lateralidades, ou seja para todos os ciclos
FREE
Apenas Cancela Ordens e Fecha Posições Exceução de cancelamento de ordens e encerramento de posições de modo rápido, para todos os ciclos de mercado Necessita do Indicador ( https://www.mql5.com/pt/market/product/79691 ) Para mais detalhes de configurações e input de variáveis entre em nossa comunidade no guilded ( https://www.guilded.gg/i/E9m8bYLE ) Inclui Rompimentos, Canais Estreitos, Canais Amplos e Lateralidades, ou seja para todos os ciclos
FREE
This indicator shows you the time of the opening and close of the trading time of every symbol. If it's out of the trading time it will show you a message in the screen, you can choose "PT-BR" or "ENG". For future updates i want to trigger a sound alarm in the preset value by the client for the opening of positions and closement of all positions. If you want anything more than that just message me in the community (  https://discord.gg/P5mcttvXgw  ) and I will update it for you!
FREE
Apenas Ajusta todas as posições para o Breakeven com relação ao Preço Médio de total Exceução de ajuste de Breakeven de modo rápido, funciona em Conta Hedge e Netting Para mais detalhes de configurações e input de variáveis entre em nossa comunidade no guilded ( https://www.guilded.gg/i/E9m8bYLE ) Inclui Rompimentos, Canais Estreitos, Canais Amplos e Lateralidades, ou seja para todos os ciclos
FREE
Apenas Cancela Ordens Exceução de cancelamento de ordens de modo rápido, para todos os ciclos de mercado Necessita do Indicador ( https://www.mql5.com/pt/market/product/79691 ) Para mais detalhes de configurações e input de variáveis entre em nossa comunidade no guilded ( https://www.guilded.gg/i/E9m8bYLE ) Inclui Rompimentos, Canais Estreitos, Canais Amplos e Lateralidades, ou seja para todos os ciclos
FREE
Apenas Abre posições em lado inverso para cada posição aberta e fecha as posições antigas Exceução de Inversão de mão de modo rápido, funciona em Conta Hedge e Netting Para mais detalhes de configurações e input de variáveis entre em nossa comunidade no guilded ( https://www.guilded.gg/i/E9m8bYLE ) Inclui Rompimentos, Canais Estreitos, Canais Amplos e Lateralidades, ou seja para todos os ciclos
FREE
Apenas Fecha Posições Exceução de fechamento de posições de modo rápido, para todos os ciclos de mercado Necessita do Indicador ( https://www.mql5.com/pt/market/product/79691 ) Para mais detalhes de configurações e input de variáveis entre em nossa comunidade no guilded ( https://www.guilded.gg/i/E9m8bYLE ) Inclui Rompimentos, Canais Estreitos, Canais Amplos e Lateralidades, ou seja para todos os ciclos
FREE
Please enable this site  https://openexchangerates.org/  on webrequest options on Tools -> Options -> Expert Advisors  this utility has it's function as a updater of your's database with the currency conversions of the day, all the days, and all the Currency Pairs. My Expert Advisors and Indicators who make auto calculation to show the lot take this data to guide their calculation, in relation to a account currency and a pair curreny who isn't the same as the account. Sample account in USD and
Funciona em Conta Hedge e Netting: - Máximo de Trades no dia - Sessão Operacional (Horário de Inicio e Termino) - Tempo Mínimo de aguardo entre operações - Ajuste de Lotes (Realiza parte da mão para poder ficar com o risco pré configurado para o risco máximo Trade a Trade) para ordens pendentes para posições em aberto Por agora funciona na gestão Trade à Trade Porém futuramente farei gestão do dia e do mês, baseando no Draw Down Máximo do Dia/Mês Eu salvo os dados em u
フィルタ:
レビューなし
レビューに返信
バージョン 2.33 2022.04.10
Bug Fix Array out of range