FX Sniper Orange indicator for MT4
- インディケータ
- Renaud Herve Francois Candel
- バージョン: 2.10
- アップデート済み: 4 7月 2023
- アクティベーション: 5
FX Sniper Orange Indicator
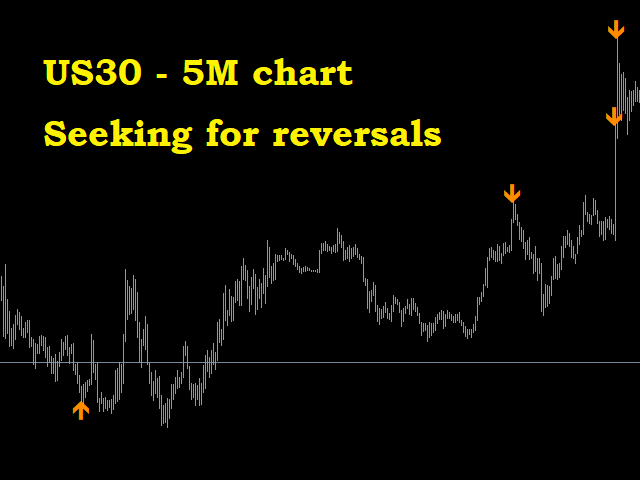
FX Sniper Orange is an exclusive indicator to spot situations where market has gone too far and market could reverse soon after.The indicator displays arrows in your chart indicating probable future price action (see screenshot attached). By default, it uses orange arrows.
FX Sniper Orange never repaints. Once candle is closed signal is confirmed and arrow will never disappear.
Users of the indicator can setup alerts when new arrows are displayed in the chart.
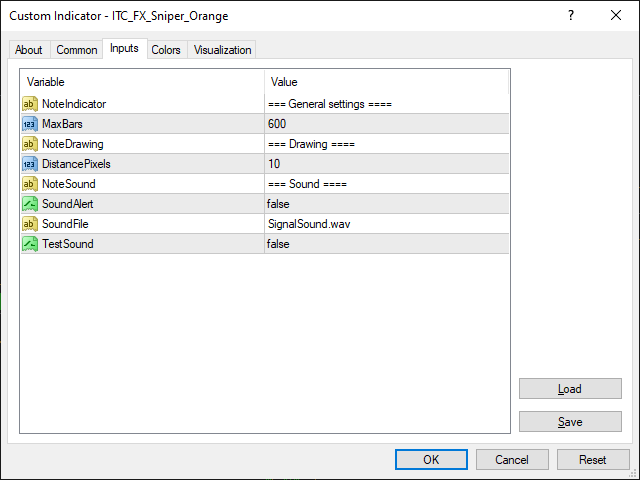
Inputs of the indicator are:
- MaxBars: bars to draw in you chart (600 is default value)
- DistancePixels: distance between arrow of the indicator and bar in the chart
- SoundAlert (True/False): to active sound alert
- SoundFile: file to be used for sound alerts
- TestSound (True/False): to test sound at init time of the indicator
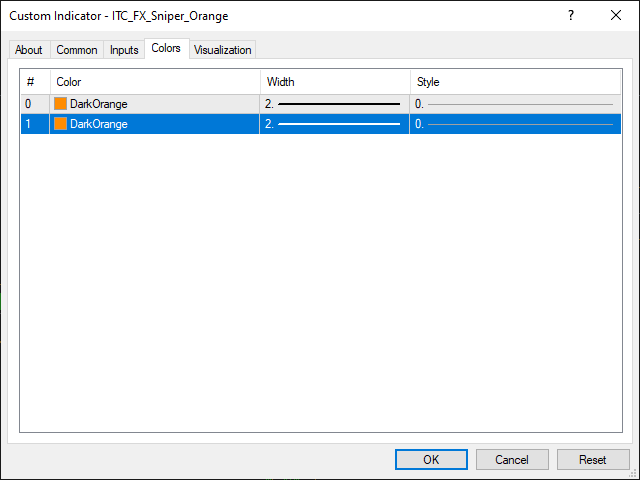
Size and color of the arrows can be setup in the Color tab of the indicator.
The indicator can be used with any time frame.
The indicator can be used to trade Options, Forex, Stocks, Indices, Futures, Commodities and Cryptos.
Other indicators for MT4:
We developed more than 60 indicators and utilities for Metatrader 4 and Metatrader 5.
Indicators for MT5:
All our indicator are developed both for MT4 and MT5.
List of all our indicators:
You can see the complete list of our indicators visiting our profile page.