Switch Symbol Timeframe By Arrows
- インディケータ
- Nguyen Thanh Sang
- バージョン: 1.20
- アップデート済み: 12 3月 2022
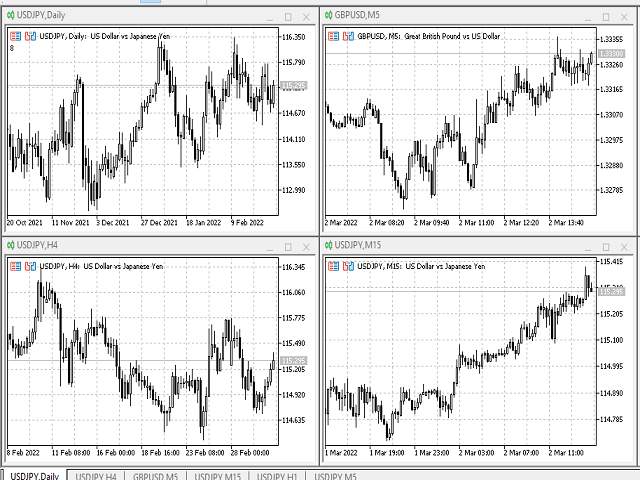
Switch symbols and timeframe by arrow buttons
1. You can switch multiple symbols of one or all charts.
2. You can set list of symbols to switch between them or get them from Market Watch.
3. You can change timeframe of one or all charts. List of timeframes here [M1, M5, M15, M30, H1, H4, D1, W1, MN1].
Switch symbol of all charts: indicator check current symbol of the chart to get index of it in list and change for next or previous.
Key functions:
- Right arrow key: switch to next symbol.
- Left arrow key: switch to previous symbol.
- Up arrow key: change to higher timeframe.
- Down arrow key: change to lower timeframe.
Version 1.10: Add more timeframes to switch: M2, M3, M4
Version 1.20: Add 5 timeframes to switch: H2, H3, H6, H8, H12


good