FJ Price Levels From CSV
- インディケータ
- Francisco Jesus Cortes Hidalgo
- バージョン: 1.0
- アクティベーション: 5
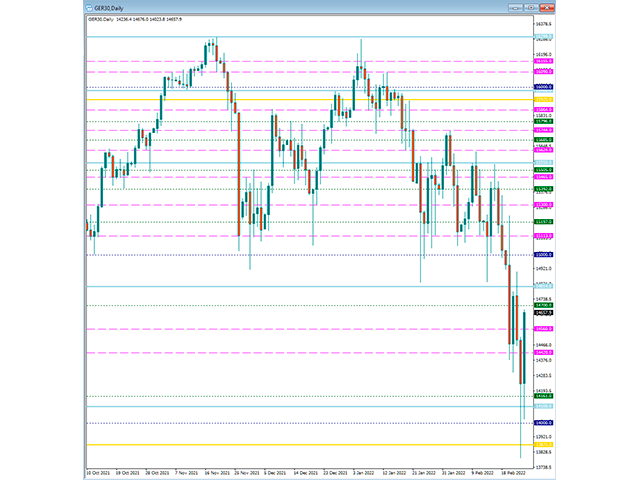
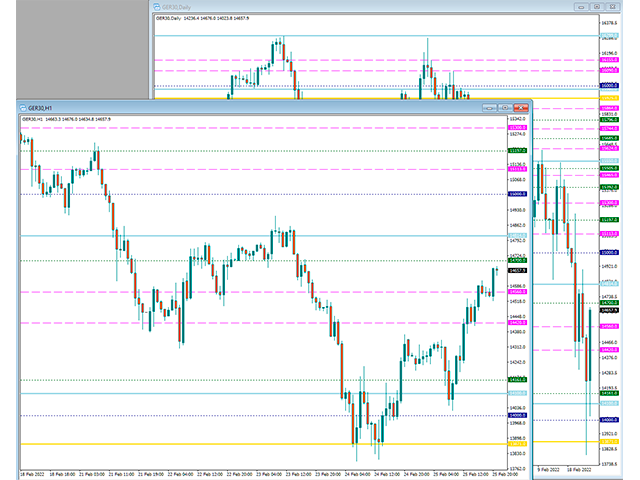
This indicator allows you to load different prices, price lines, from file. You can easily import the same information between all your windows, without the worry of replicating the same information window to window. In addition, up to 6 different groups are allowed to be able to configure their visualization in a different way and the possibility of activating or not visually each group, at your convenience.
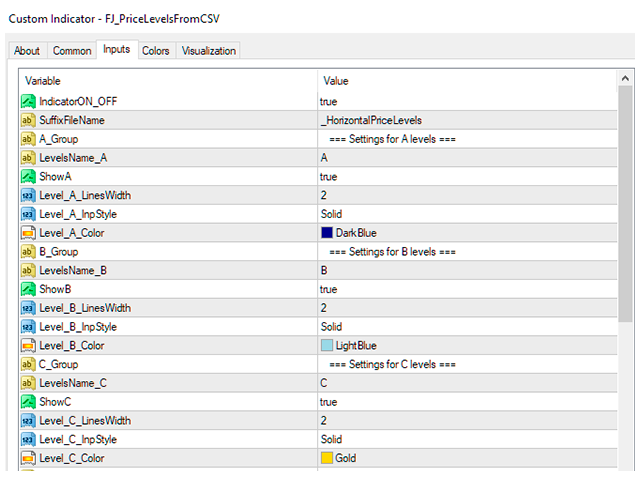
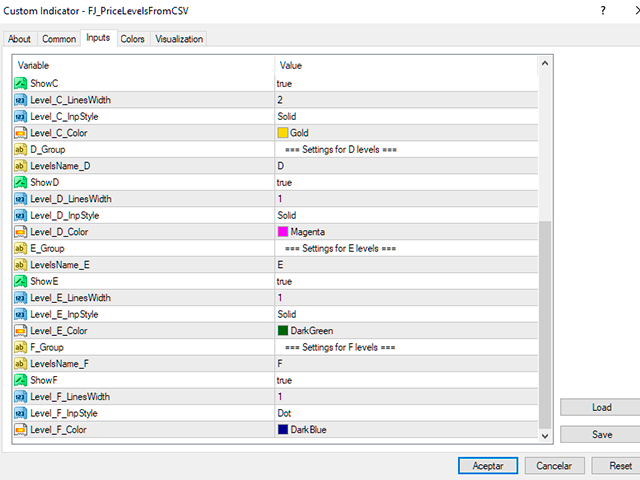
Configuration, indicator variables:
-IndicatorON_OFF: Allows you to enable or disable all the painting of the price lines on the chart window without the need to download the indicator from the list of indicators
-SuffixFileName: It is the suffix that is part of the file in which the price levels to be painted are found. At the end of the entire list of variables, I explain how to configure the file with the price data.
-A_Group: Below is the first block of parameters to be used for the first set of price lines.
-LevelsName_A: The name with which you indicate in the csv file how these price lines are identified.
-ShowA: Select 'False' if you don't want the lines of this group (A_Group) to be painted on the graph screen
-Level_A_LinesWidth: The width of the lines for this group
-Level_A_InpStyle: The type of line, it can be solid, dotted, etc.
-Level_A_Color: Allows you to choose the desired color for the price lines belonging to this group
The following parameters that appear belong to 5 more groups and allow to specify the same as for group 'A' described.
File configuration
It starts from a .csv file located in the following folder:
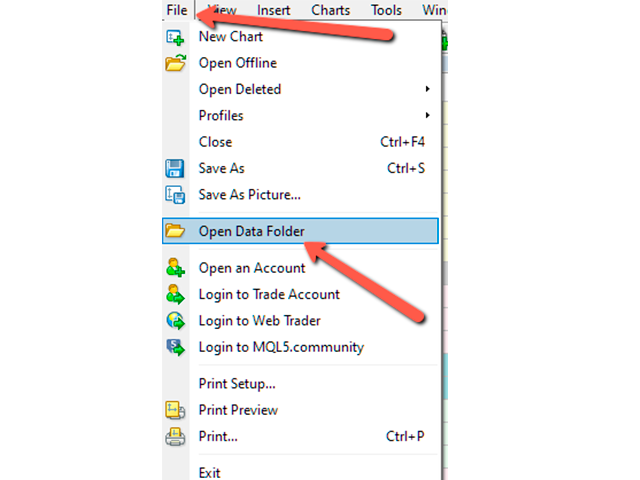
1 - Select in Metatrader the File menu-> "Open Data Folder" (You can see screenshots as help)
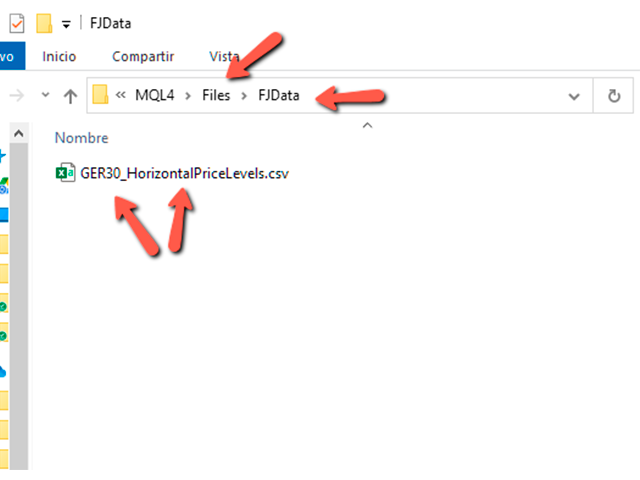
2 - Navigate to the MQL4->Files directory
3 - In Files, create a subdirectory (if you haven't already created it) called 'FJData' (without the quotes) and enter it
4 - Create the file putnameofyourchartwindowhere_HorizontalPriceLevels.csv. For example, on my mt4, the name of the DAX is called GER30. And we will add as a suffix what we indicate in the SuffixFileName indicator variable, that is, in my case I will create a file called GER30_HorizontalPriceLevels.csv (You can see screenshots to help). You can use Notepad to edit the content of the file. If you're using Excel, be careful not to save the file in another format, as Excel will prompt you to do so.
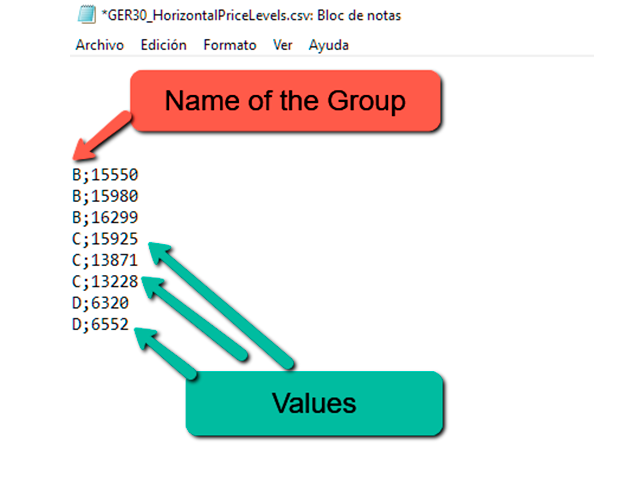
5 - We will fill the content of the file as we need using a semicolon (;) as a separator. (You can see screenshots to help) If we have chosen as name for the first group, A, and for the second, B, a valid example of 4 rows in the file would be:
A;11010
A;12411
B;7080
b;8690
6 - In this example, A and B, would be the names that have to be declared in the parameters of the indicator LevelsName_A and LevelsName_B, and in this way the indicator will recognize all the rows called A within the csv file
Nothing more, I hope you enjoy this little tool that allows you to easily manage useful information between Metatrader windows.
Note: To avoid accidentally moving lines, price levels cannot be selected in the chart window.
