Deviation from Alligator
- インディケータ
- Yevhen Sereda
- バージョン: 1.0
- アクティベーション: 5
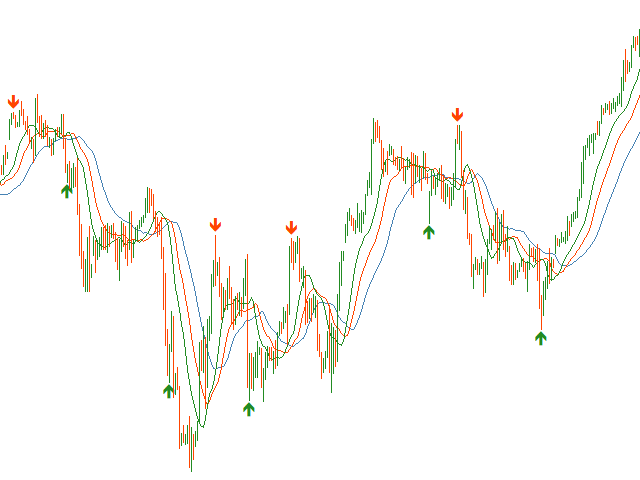
The indicator signals the appearance of a possible divergent bar based on the shape of the bar and its standard deviation from the Alligator indicator.
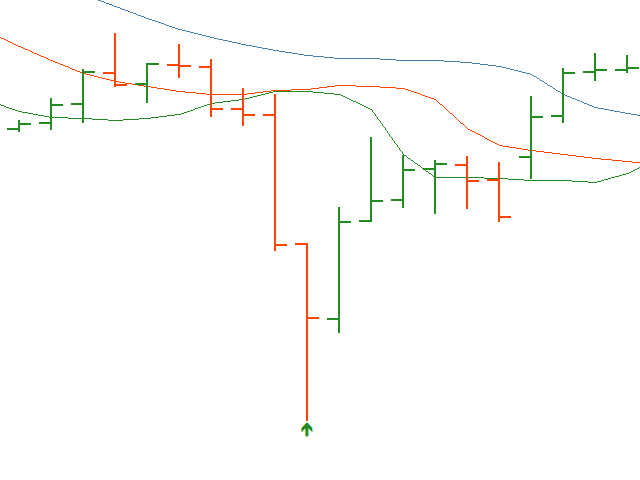
A bullish divergent bar is a bar that closes in its upper half (the higher the better), has a lower minimum than the previous bar, and drops sharply away from the Alligator.
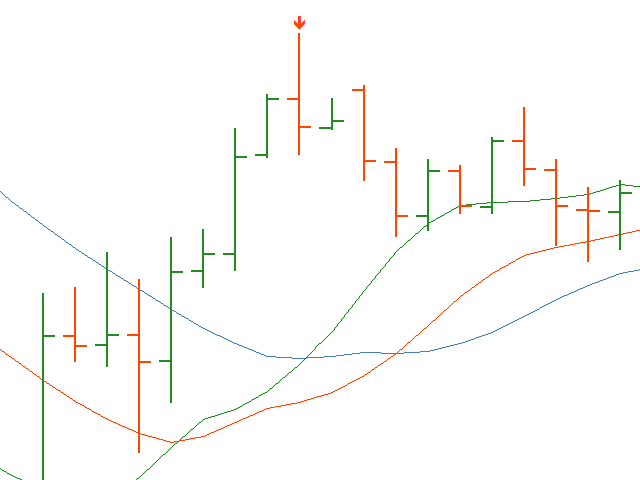
A bearish divergent bar is a bar that closes in its lower half (the lower the better), has a higher high than the previous bar, and moves up sharply from the Alligator.
Standard deviation is a measure of how far a value is from its mathematical expectation.
SETTINGS
History - historical signal limit.
Bar closing - a condition for closing a signal bar.
Standard deviation - a coefficient of the distance of the signal bar from the Alligator (the higher the value, the rarer the signals).
Extremum - the number of bars by which highs and lows are determined.
Up arrow color - bullish signal color.
Down arrow color - bearish signal color.
Alerts - signal notification.