Gartley Hunter MT5
- インディケータ
- Siarhei Vashchylka
- バージョン: 1.10
- アップデート済み: 23 4月 2024
- アクティベーション: 10
Manual (Be sure to read before purchasing) | Version for MT4
Advantages
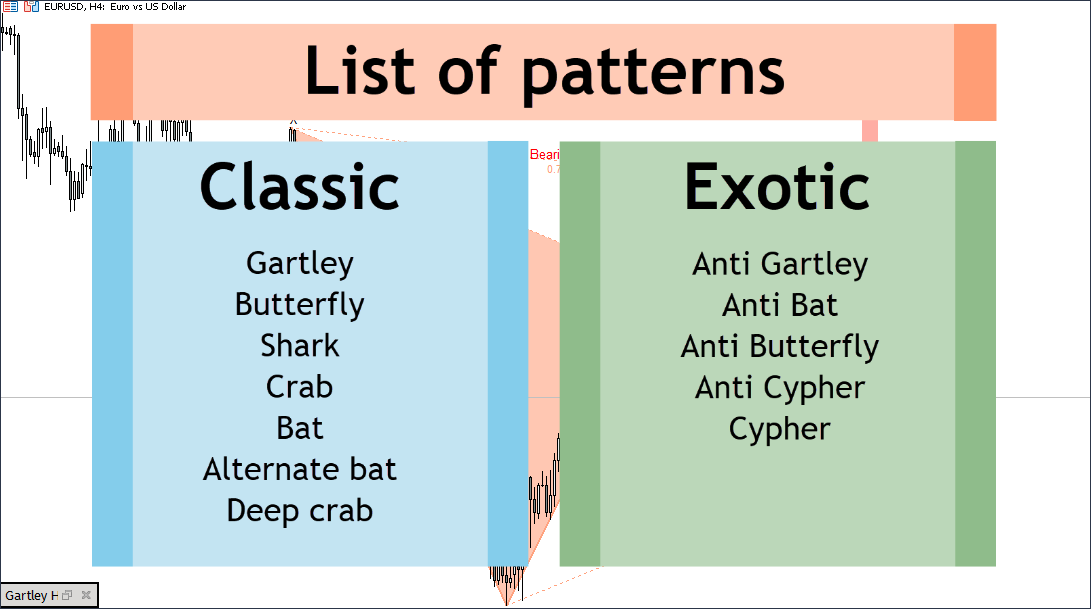
1. 12 harmonic patterns: 7 classical and 5 exotic. New patterns will be added as the indicator develops.
2. Constant automatic search for harmonic patterns. The indicator is capable of finding from the smallest to the largest patterns.
3. Automatic search for pattern projections. A projection is a potential pattern that may form in the future.
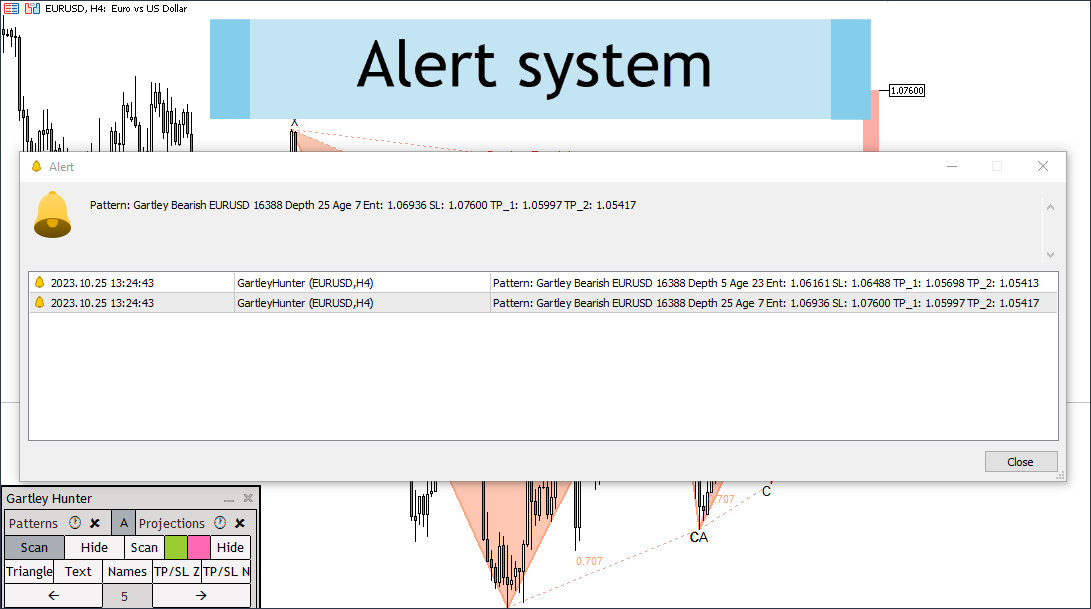
4. Stop Loss and Take Profit levels. To the right of each pattern are targets for entering and exiting a trade.
5. Detailed pattern customization system. You can add and remove various pattern elements in a few clicks.
Author: Siarhei Vashchylka. For any questions, write to me in private messages. I also recommend subscribing to my updates. To do this, follow the link to my profile and click "Add to friends".


Отличный индикатор! Хорош даже для таких "чайников" как я, которые практически ничего не понимают в том, как образуются эти паттерны. Просто нажимаешь кнопку "сканирования" и видишь их. Может в любой момент убрать или добавить снова на график. Есть тэйк профит и стоп лосс. Можно изменить оформление, хотя базовый мне подходит. Очень удобно и наглядно.