Hot Zones MT5
- インディケータ
- Innovicient Limited
- バージョン: 1.31
- アップデート済み: 23 3月 2024
- アクティベーション: 5
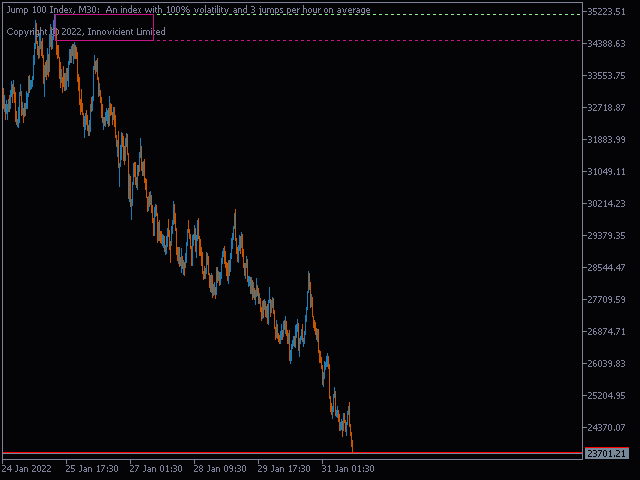
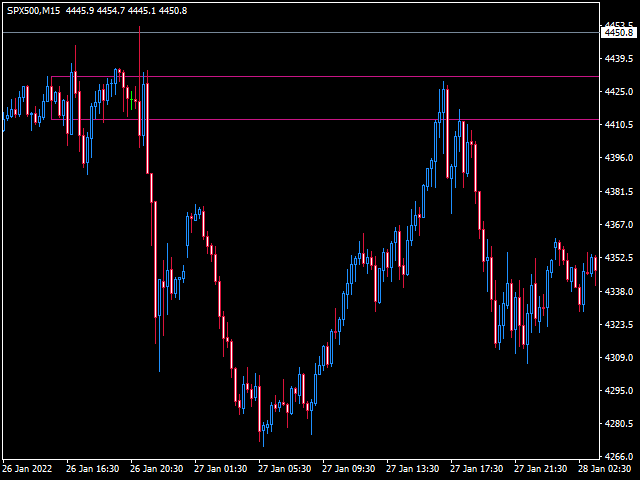
This indicator simplifies your entry zones by displaying the areas where you can plan your entry that potentially could give you high risk/reward ratios.
Other than picking the most optimal entry points, the Hot Zone indicator can act as your typical support/resistance indicator for pullbacks for all timeframes.
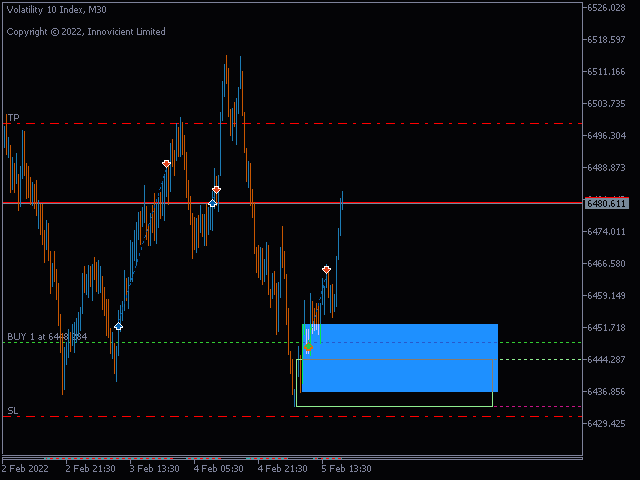
You can use this indicator as the only trading indicator or use it with another indicator for reentry purposes. Besides, when using Hot Zones, the risk/reward ratio should be well above 1:2. Place your SL some few points below the zones and keep locking profit for you to take advantage of the trend since the reward may be significantly large-depends what's your goal.
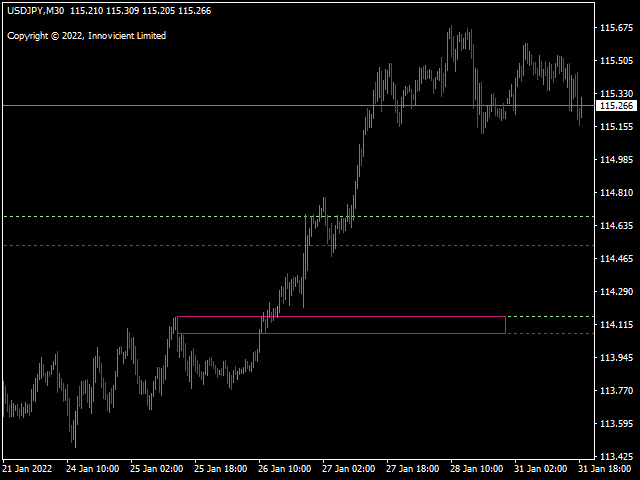
In addition, there is an inbuilt dynamic support/resistance function that keeps track of the most immediate areas where the price is most likely to react.
Ideal for all instruments: Currencies, Cryptocurrencies, Stocks,Synthetic Indices on Deriv, etc.
Notes:
- Watch the market if the hot zone boxes are wide, especially after candle spikes. This increases your SL, therefore, may decrease your risk/reward ratio.
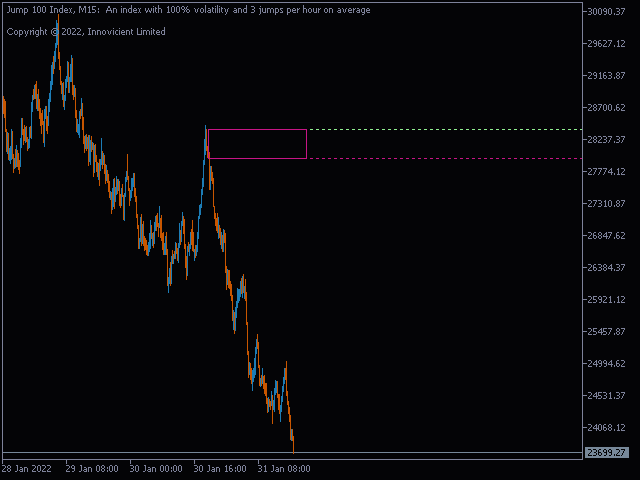
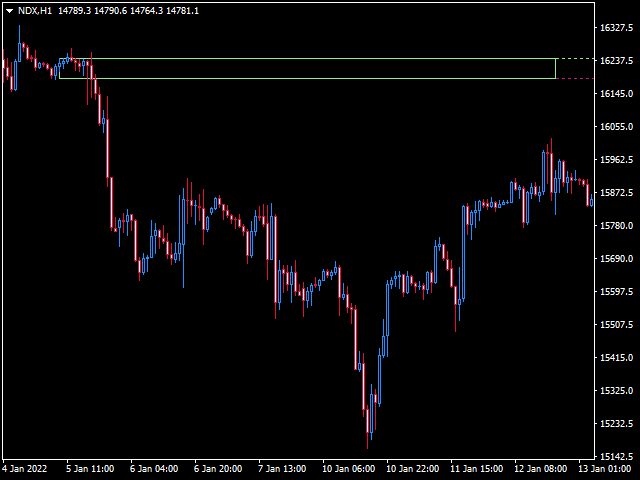
- If the violet and light green hot zones form close to each other, your target profits should be tight until price breaks out on either of the side of both zones.
- As the hot zone shadows (dotted lines) move away from the start of the box, the less effective they become, therefore, signals that emerge at the beginning are stronger.
-
If both the Hot Zones and the Dynamic Support/Resistance boxes form, the breakout is expected to be significant. However, you can chose to use any one of those functions.
-
You can chose to work with either Hot Zones or the Dynamic Support/Resistance independently depending on your trading style.
-
Under the Hot Zones function there are three trading modes, Cheetah, Jumbo, and Sloth. The Cheetah module is more reactive and provides more trading signals compared with the Jumbo whereas Sloth module takes longer than Jumbo to scan for hot zones- these animals react at different speeds, but all are effective at what they do.
-
This system has been tested with all trading instruments and works well for manual traders. In addition, it has been tested on Deriv Broker's synthetic indices and produces same predictability as other financial instruments.
-
You can use Hot Zones indicator to compliment your trading system as well.
-
Alerts added.
Basic Guidelines
The default settings work perfectly well. However, should you need help to guide you on the most effective usage drop me a chat message.