Fibonacci Bollinger Bands MT4
- インディケータ
- Diego Arribas Lopez
- バージョン: 1.0
Fibonacci Bollinger Bands MT4
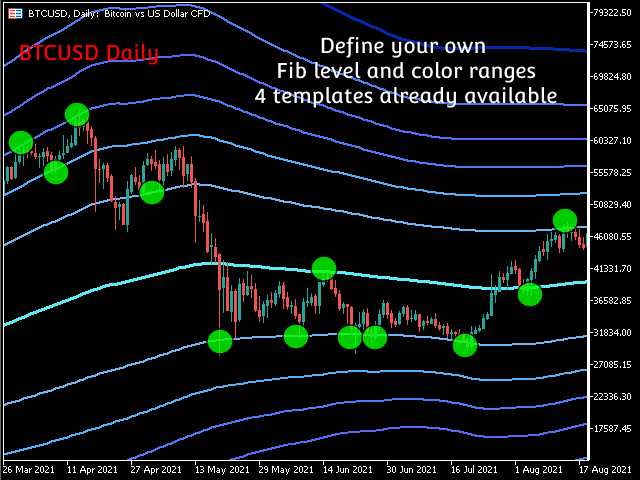
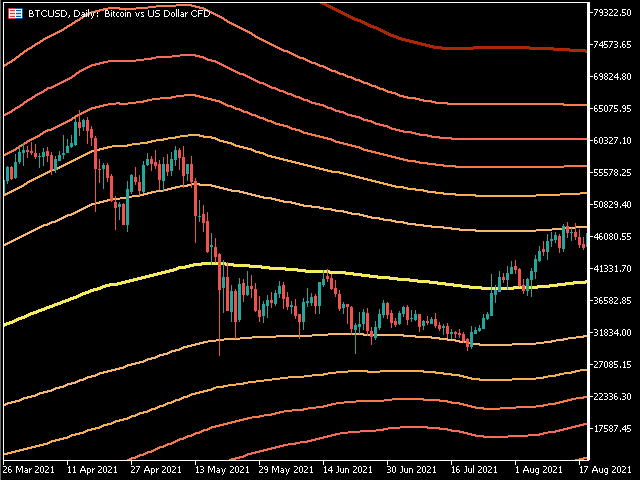
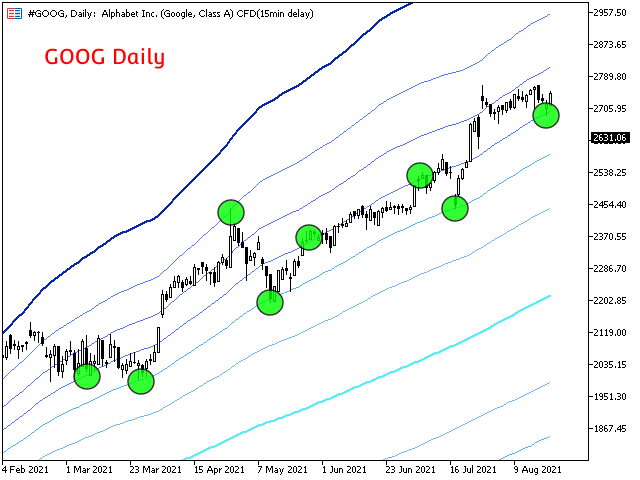
Fibonacci Bollinger Bands is a highly customizable indicator that shows areas of support and resistance. This indicator combines the logic for the Bollinger Bands with the Fibonacci level. Fibonacci Bollinger Bands is the first indicator in the market that allows the user to 100% customize up to 12 Fibonacci levels, the Moving Average type and the price data source to use for the calculations. This flexibility makes the Fibonacci Bollinger Bands easily adaptable for any Asset and Timeframe! The Fibonacci levels can be modified or deactivated if desired setting its value to 0.
TRY IT FOR FREE NOW!!
The levels highlighted by the indicator show areas of support and resistance where a price reaction can be expected. It is also common to see the price coming back to retest these Fibonacci levels offering good potential entry points.
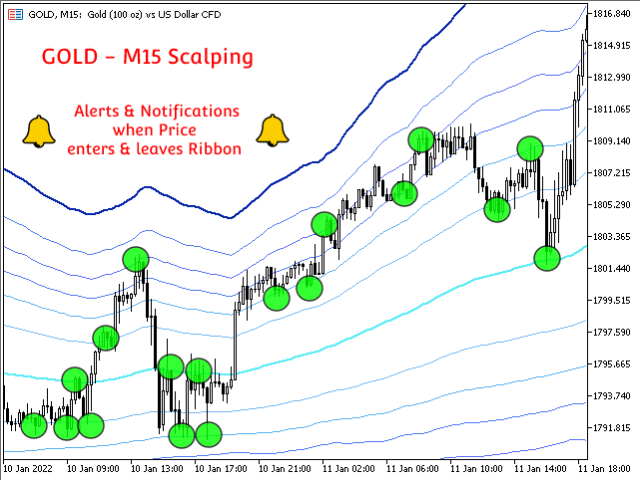
Ideal for HOLD , SCALPING and SWING strategies
At the same time, Fibonacci Bollinger Bands MT4 provides a system of alerts and notifications on the mobile phone and on the MT4 Terminal when the prices touches any of its levels.
Some of the characteristics of the indicator are the following:
- Time saving
- Ease of decision-making for entries and taking full or partial benefits
- Highly customizable
- Functional in all pairs (Crypto, Forex, Stocks, Indices, Commodities ...)
- Perfect for Scalping or Swing trading
- Alerts and notifications on the MT4 terminal and on the mobile phone
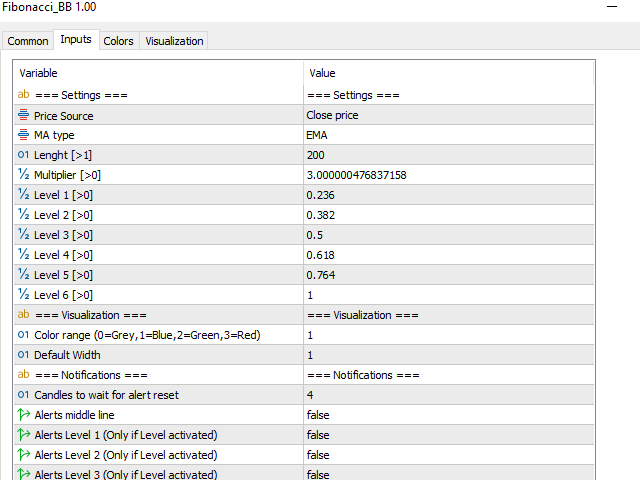
Input parameters
Settings:
- Price Source: Price source for the MAs
- MA type: Moving average type (SMA, EMA, Linear Weighted MA, Smoothed MA)
- Lenght [>1]: MA Period for the Middle Line
- Multiplier [>0]: Bollinger Bands' multiplier [>0]
- Level 1 [>0]: Fibonacci Level 1 for Upper and Lower Band
- Level 2 [>0]: Fibonacci Level 2 for Upper and Lower Band
- Level 3 [>0]: Fibonacci Level 3 for Upper and Lower Band
- Level 4 [>0]: Fibonacci Level 4 for Upper and Lower Band
- Level 5 [>0]: Fibonacci Level 5 for Upper and Lower Band
- Level 6 [>0]: Fibonacci Level 6 for Upper and Lower Band
- Color range (0=Grey,1=Blue,2=Green,3=Red): 4 Default color ranges
- Default width: Default width for all Levels
Notifications:
- Candles to wait for alert reset: Number of candles to reset the Alerts at each level
- Alerts middle line: Enables alerts on the MT4 Terminal if price touches the Middle Line
- Alerts Level 1 (Only if Level activated): Enables alerts on the MT4 Terminal if price touches Level 1
- Alerts Level 2 (Only if Level activated): Enables alerts on the MT4 Terminal if price touches Level 2
- Alerts Level 3 (Only if Level activated): Enables alerts on the MT4 Terminal if price touches Level 3
- Alerts Level 4 (Only if Level activated): Enables alerts on the MT4 Terminal if price touches Level 4
- Alerts Level 5 (Only if Level activated): Enables alerts on the MT4 Terminal if price touches Level 5
- Alerts Level 6 (Only if Level activated): Enables alerts on the MT4 Terminal if price touches Level 6
- Activate Notifications: Enables phone Notifications
Support and questions
Do not hesitate to contact me for any questions and support
Author
Diego Arribas, private investor and speculator, automation engineer in the aerospace industry