Supply Demand new Strategy
- インディケータ
- Mohamed yehia Osman
- バージョン: 1.6
- アクティベーション: 10
This is a new strategy for SUPPLY DEMAND areas
It is based on a calculation using the tick volume to detect the big price action in market for both bear /bull actions
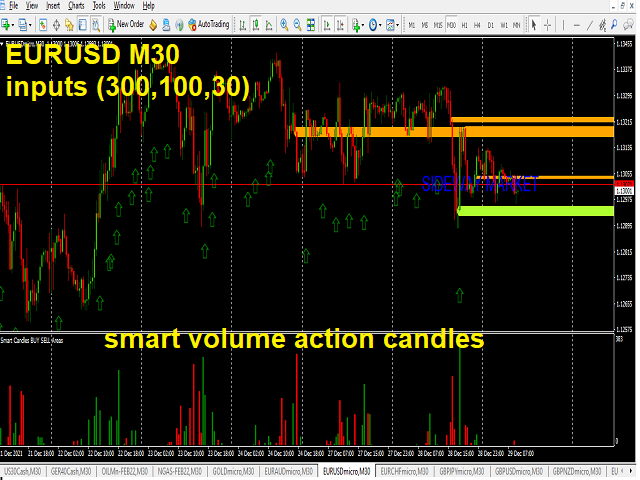
this smart volume action candles are used to determine the supply and demand areas
prices in between main supply and demand lines indicate sideway market
up arrows will be shown when prices moves above the main supply and the secondary supply lines
Down arrows will be shown when prices moves below the main demand and the secondary demand lines
your inputs are 3 values (referring to bars count /range ) for calculations of 3 supply/demand areas
works for any symbols
work with any timeframe - but you can adjust your input areas values according to your trading strategy
default values are (300 , 100 ,30 ) on M30 charts
(SURELY if used with real volume in stocks market --- it will be great helpful and indicative)
TRY the demo before any purchase !!


